2026 Home Sales Data - Mid Year Review for
Leelanau & Grand Traverse County
The Leelanau County real estate market posted another strong performance during the first half of 2026, with 151 homes sold between January 1 and June 30, up from 130 sales during the same period in 2025. Overall sales volume increased from $110.4 million to $141.6 million, reflecting continued demand for homes throughout Leelanau County. The average sale price climbed to $937,506, an increase of more than 10% year over year, highlighting the strength of the area's luxury and waterfront markets. While the median home price dipped slightly to $640,000 from $662,500, home values remain among the highest in Northern Michigan. Whether you're considering buying or selling a home in Leelanau County, Suttons Bay, Lake Leelanau, Leland, Glen Arbor, Northport, or the surrounding communities, understanding local market trends is essential for making informed real estate decisions. As a local Leelanau County Realtor, I provide expert market analysis, neighborhood insights, and personalized guidance to help buyers and sellers successfully navigate today's competitive market.
Jonathan Oltersdorf
Oltersdorf Realty LLC
231-218-0509
Oltersdorf.com
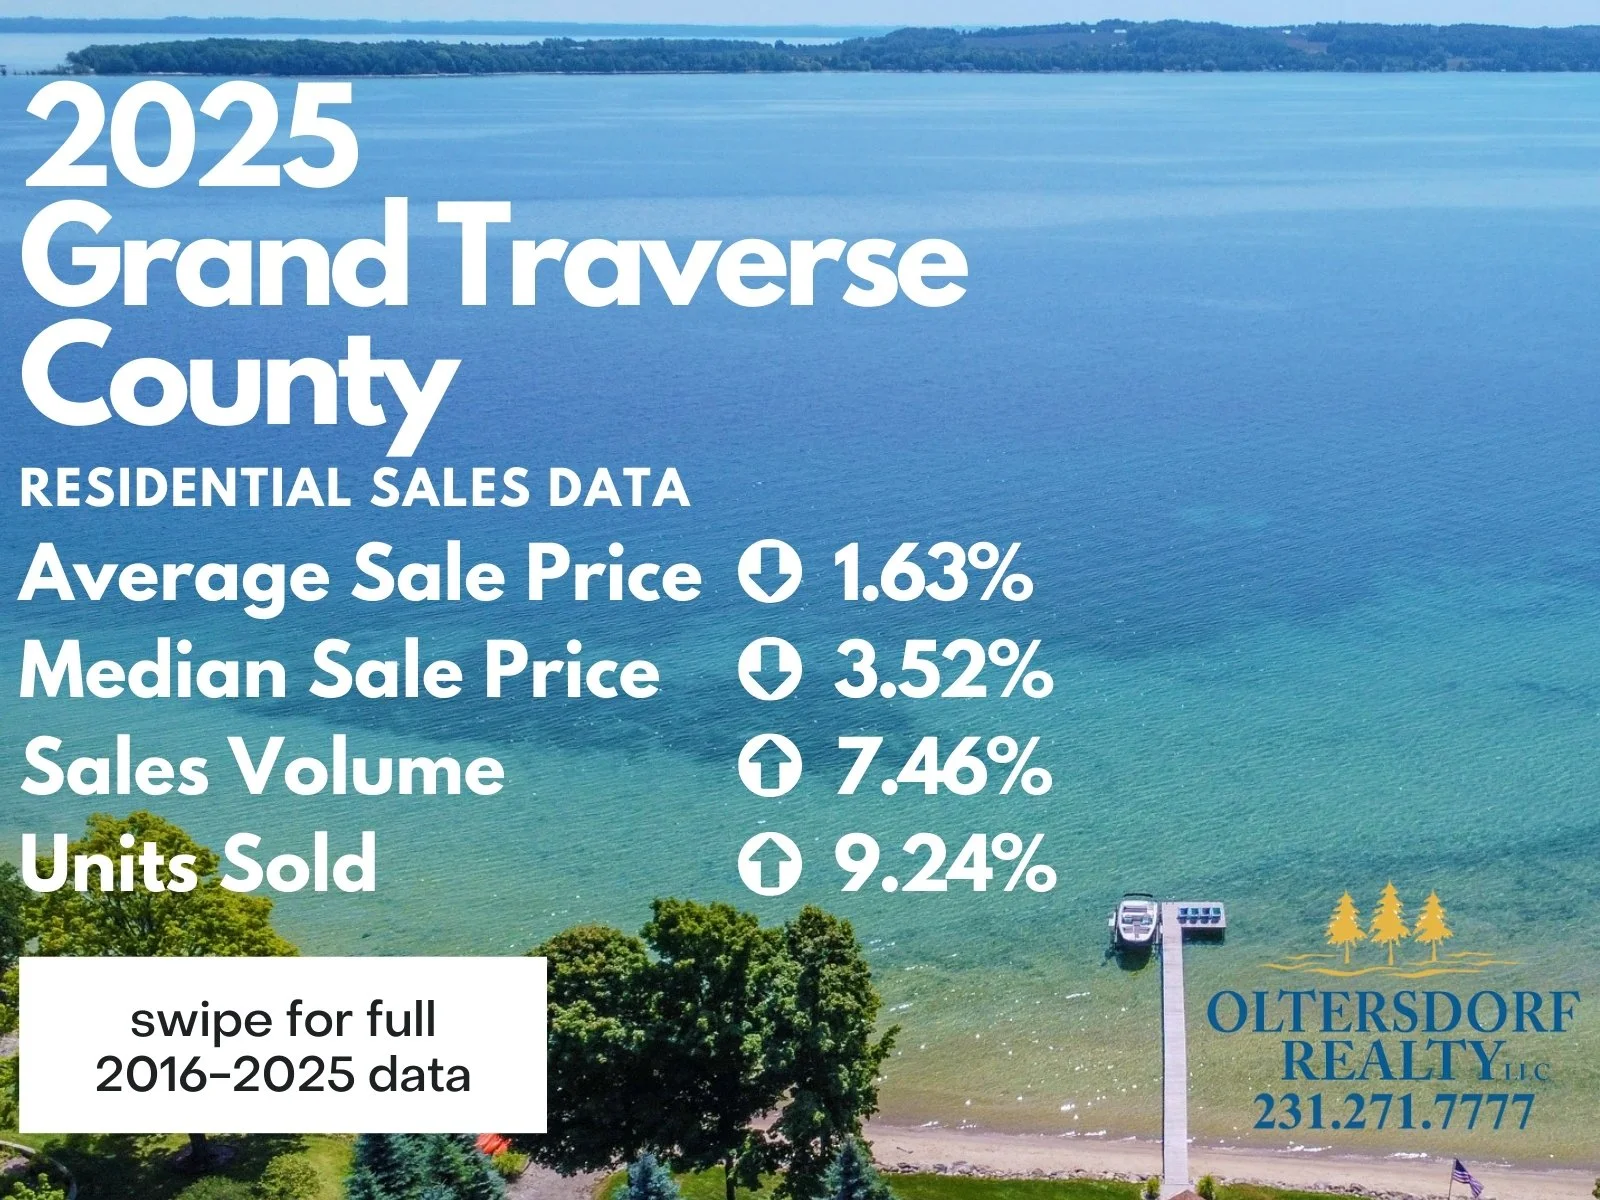
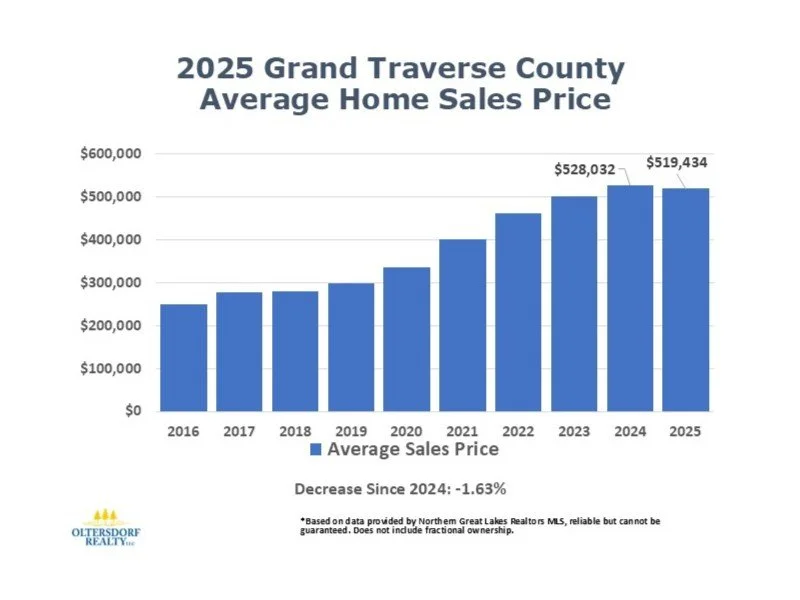
The Grand Traverse County real estate market saw a shift during the first half of 2026, with 571 homes sold between January 1 and June 30 compared to 652 sales during the same period in 2025. While overall sales volume declined from $335.1 million to $277.4 million, the median home price increased to $420,000, reflecting continued demand for well-priced homes in the Traverse City housing market. The average sale price decreased to $485,836, suggesting fewer high-end luxury transactions influenced the market. Whether you're considering buying or selling a home in Grand Traverse County, Traverse City, or the surrounding Northern Michigan communities, understanding current market trends is essential for making informed real estate decisions. As a local Traverse City Realtor serving Grand Traverse County and neighboring areas, I provide in-depth market analysis, neighborhood insights, and expert guidance to help clients successfully navigate today's changing market.
Jonathan Oltersdorf
Oltersdorf Realty LLC
231-218-0509
Oltersdorf.com