


Centrally located between Traverse City and Suttons Bay in the desirable Leelanau Highlands development, this 0.89-acre vacant building site offers a beautiful, wooded, hilltop setting with privacy and scenic surroundings. The property backs to HOA common area, providing additional separation from neighboring parcels. The gently sloping terrain creates a unique opportunity for a home designed to take advantage of the natural landscape with a walkout possible in 3 directions. The ability to connect to the community septic system (connection fee paid by current owner) helps simplify the building process and reduce construction costs. Underground utilities, natural gas, and cable are available. Enjoy convenient access to nearby public boat launches, the Leelanau Trail, and all the amenities of both Traverse City and Suttons Bay. A great opportunity to build your Northern Michigan dream home in a peaceful, private setting, surrounded by upscale residences, including $1+ million homes!
Lot 19 – S Cherry Blossom Lane, Suttons Bay - SOLD
LISTED & SOLD BY OLTERSDORF REALTY ON 7/17/2026
$75,000 - Lot 19 – S Cherry Blossom Lane, Suttons Bay, MI – 0.86 Acres with 700’ Shared on West Bay!


Centrally located just 5 minutes from the charming year-round Village of Suttons Bay and only 20 minutes from downtown Traverse City, this level 0.86-acre corner parcel is mostly cleared and ready for construction of your future Leelanau home. The flat topography offers an easy building site with reduced excavation costs. Best of all, there are no HOA fees and no required timeframe to build. Take a short 0.25-mile walk down the hill or a quick 1.8-mile drive and start enjoying the shared waterfrontage on West Grand Traverse Bay! Knorrwood Bluffs is a popular neighborhood known for its rolling terrain, mature hardwoods, quiet roads, and peaceful setting. This well-established subdivision offers underground electric, natural gas, cable tv/internet, county-maintained roads, protective covenants, and a 1,250 sq. ft. minimum building requirement. Enjoy 700 feet of shared frontage on West Grand Traverse Bay, providing opportunities for swimming, boating, kayaking, and waterfront recreation. Owners who choose to participate in install/maintenance share the cost and use of a private dock. Kayak storage is conveniently allowed at the beach. Check it out!!!
2026 Home Sales Data - Mid Year Review for Leelanau & Grand Traverse
2026 Home Sales Data - Mid Year Review for
Leelanau & Grand Traverse County
The Leelanau County real estate market posted another strong performance during the first half of 2026, with 151 homes sold between January 1 and June 30, up from 130 sales during the same period in 2025. Overall sales volume increased from $110.4 million to $141.6 million, reflecting continued demand for homes throughout Leelanau County. The average sale price climbed to $937,506, an increase of more than 10% year over year, highlighting the strength of the area's luxury and waterfront markets. While the median home price dipped slightly to $640,000 from $662,500, home values remain among the highest in Northern Michigan. Whether you're considering buying or selling a home in Leelanau County, Suttons Bay, Lake Leelanau, Leland, Glen Arbor, Northport, or the surrounding communities, understanding local market trends is essential for making informed real estate decisions. As a local Leelanau County Realtor, I provide expert market analysis, neighborhood insights, and personalized guidance to help buyers and sellers successfully navigate today's competitive market.
Jonathan Oltersdorf
Oltersdorf Realty LLC
231-218-0509
Oltersdorf.com
The Grand Traverse County real estate market saw a shift during the first half of 2026, with 571 homes sold between January 1 and June 30 compared to 652 sales during the same period in 2025. While overall sales volume declined from $335.1 million to $277.4 million, the median home price increased to $420,000, reflecting continued demand for well-priced homes in the Traverse City housing market. The average sale price decreased to $485,836, suggesting fewer high-end luxury transactions influenced the market. Whether you're considering buying or selling a home in Grand Traverse County, Traverse City, or the surrounding Northern Michigan communities, understanding current market trends is essential for making informed real estate decisions. As a local Traverse City Realtor serving Grand Traverse County and neighboring areas, I provide in-depth market analysis, neighborhood insights, and expert guidance to help clients successfully navigate today's changing market.
Jonathan Oltersdorf
Oltersdorf Realty LLC
231-218-0509
Oltersdorf.com
7877 E Bernadette Drive, Suttons Bay - SOLD
SOLD SUTTONS BAY VACANT ACREAGE + POLE BARN
SOLD by Oltersdorf Realty LLC on 7/7/2026
$309,000
JUST SOLD in Suttons Bay | $309,000 Ask Price – 7877 E Bernadette Drive, Suttons Bay, MI - 10.32 Acre Vacant Lot with a pole barn, RV connections, electrical, spring fed creek, and approved septic location. Located on the east side of South Lake Leelanau between Suttons Bay & Traverse City! Buyer Agent -> Jonathan Oltersdorf, Oltersdorf Realty.
8282 S Center Highway, Traverse City - SOLD
SOLD ELMWOOD TOWNSHIP HOME
SOLD by Oltersdorf Realty LLC on 7/7/2026
$549,900 Ask Price
JUST SOLD in Elmwood Township, Traverse City | $549,900 Ask Price – 8282S Center Highway, Traverse City, MI - 4 Bedroom, 2.5 bath 2 story home on 6.38 acres in Leelanau County! Includes adjacent build-able lot! Buyer Agent -> Jonathan Oltersdorf, Oltersdorf Realty.


9742 E Peterson Road, Northport – NEW LISTING


Set high on a secluded 6+ acre hilltop, this walkout ranch built in 2022 offers outstanding privacy as well as year-round distant views of Lake Michigan! In like-new condition and designed for low-maintenance living, it's well suited for use as a full-time residence or as a Leelanau County vacation home. Vaulted ceilings, abundant natural light, and a cozy wood-burning stove create a warm and inviting great room, while the island kitchen features a convenient pantry/coffee station and plenty of workspace. The spacious main-floor primary suite includes 9-foot ceilings, heated bathroom floors, a tiled walk-in shower, and a large walk-in closet. Main-floor laundry and a half bath add to one floor convenience. Downstairs, the walkout lower level offers 8'8" ceilings, a large family room with a wet bar and beverage cooler, a full bath with a tub, and a third non-conforming bedroom that's ideal for guests, a home office, or hobby space, and unfinished storage space. Outdoor living is just as inviting, with a covered front porch featuring tongue-and-groove ceilings and composite decking, plus a rear composite deck overlooking the rolling countryside and distant Lake Michigan views. Thoughtfully built by Whiteford Associates with quality finishes and easy upkeep throughout, this property lets you spend less time on maintenance and more time enjoying everything Leelanau County has to offer!
2171 N Belanger Creek Drive, Suttons Bay - SOLD
SOLD SUTTONS BAY CREEKSIDE VACANT PARCEL
LISTING SOLD by Oltersdorf Realty LLC on 6/23/2026
$198,500 – 2171 N Belanger Creek Drive, Suttons Bay, MI – 2.05 Acre Creekside Building Site!


Belanger Creek – Lot 7. This private, quiet parcel offers a tranquil creekside building site with Belanger Creek flowing along the rear of the lot. Situated just 3 miles from the Village of Suttons Bay, it’s tucked at the end of a paved cul-de-sac and offers underground utilities, including natural gas and high-speed cable internet. Residents enjoy 8.5 acres of common open space, 2,100 feet of creek frontage, shared pond frontage, and building restrictions that maintain high-quality construction. Outbuildings are allowed on this parcel. Adjacent parcels are also available to purchase.
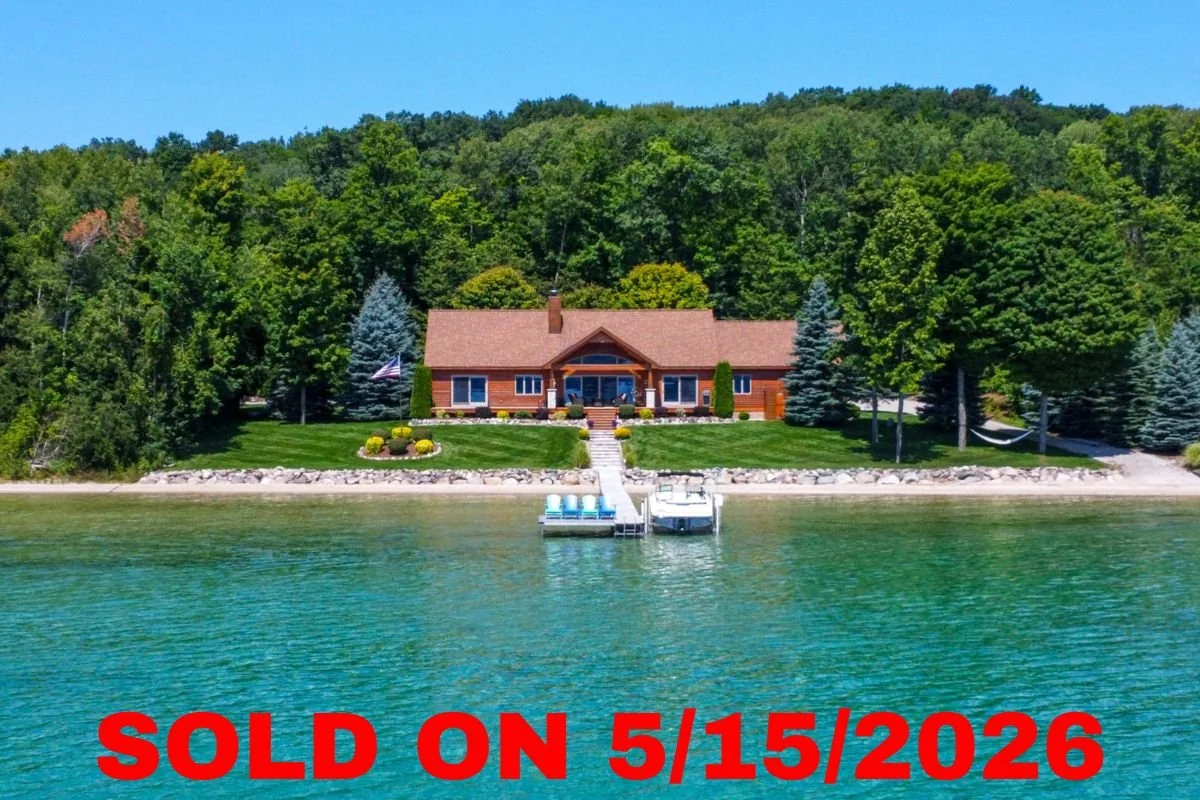
10829 N Shore Drive, Northport – SOLD
SOLD NORTHPORT OCTAGON HOME
LISTED & SOLD by Oltersdorf Realty LLC on 5/15/2026
$425,000 - 10829 N Shore Dr, Northport, MI – Unique Octagon Home on 1.61 Acres in the Village of Northport!


Tucked away in a quiet location at the northern edge of the Village of Northport, this unique Octagon one level house offers a rare price point for one of Leelanau County’s most desirable communities. Just a quick ¾ mile bike/walk from Northport’s vibrant waterfront park, beaches, marina, shops, restaurants, library, schools, and more—you’re close to it all, yet tucked away on ~1.61 acres of land with a meandering creek at the rear of the property. This one of a kind 2-bedroom + den, 2-bath home offers approximately 1,275 square feet of living space, large front deck, rear screened-in porch, and municipal sewer/water. The oversized 3+ car Octagon detached garage was built as the same footprint of the house at 1,275 sq ft. Whether you're looking for a year-round home, a vacation getaway, or an investment with upside, this one checks all the boxes. Perfect for creatives, designers, or anyone tired of boxy living! Northport is a welcoming, artsy village nestled on the shores of Grand Traverse Bay, at the northern edge of picturesque Leelanau County. It's a gateway for boating, beaches, hiking, and all things lakeside living.
1564 N West Bay Shore Drive, Suttons Bay, MI – SOLD


Discover your own private paradise with this rarely available property. Situated on one of the largest frontages on beautiful Suttons Bay, this exquisite lakefront ranch home offers 275 feet of private shoreline. The preferred east-facing lot ensures stunning sunrises - relax on the waterside covered porch, where you can unwind to the soothing sounds of waves gently lapping the waterfront. Built in 2013, this modern home is surrounded by granite stone walls and beautiful blue spruce trees, providing total privacy. The property includes a matching potting shed with full electric, two workbenches, and ample storage space for tools and toys. Inside, the home features 3 bedrooms and 2.5 baths, including a waterside master suite with a walk-in shower, tub, and an additional outdoor shower equipped with hot and cold water. The great room, dining room, kitchen, and master suite all offer breathtaking views of Suttons Bay and Stony Point. The chef's kitchen is equipped with dual sinks, granite countertops, custom cabinets, a built-in stovetop, oven, refrigerator, microwave, and dishwasher. The open floor plan seamlessly connects the great room, dining room, and kitchen, making it perfect for entertaining. A quarry stone-faced gas fireplace adds a touch of warmth and elegance. Sliders from the great room, dining room, and master bedroom lead to an expansive deck, partially covered with four skylights to allow natural light while providing shelter in inclement weather. Flagstone steps guide you to the water’s edge, where you'll find a 120-foot dock with a patio, perfect for waterside entertaining and taking in the views. The dock is equipped with electric and water services to meet your boating needs. This all-weather, low-maintenance home requires minimal annual upkeep, allowing you more time to enjoy its beauty. Located just 2 miles north of Suttons Bay, you'll have easy access to the town's many amenities, including restaurants, shopping, theater, library, and beaches! The nearby bike path connects Suttons Bay to Traverse City, which is only a 20-minute drive away, recently voted one of the best beach towns in America. Sleeping Bear Dunes National Lakeshore is also just a 30-minute drive away!
3378 Silver Farms Lane, Traverse City - SOLD
SOLD TRAVERSE CITY 2 STORY HOME
SOLD by Oltersdorf Realty LLC on 5/15/2026
$710,000 Ask Price
JUST SOLD in Silver Farms, Traverse City | 3378 Silver Farms, Traverse City, MI – 3 Bedroom, 3.5 Bath, 3,100 sq ft 2 story home on 0.60 acres in Silver Farms, close to Downtown Traverse City! Buyer Agent -> Jonathan Oltersdorf, Oltersdorf Realty.
3784 S Lee Point Road, Suttons Bay – NEW LISTING


Rarely available, this south-facing private frontage on West Grand Traverse Bay offers 200’ of some of the finest sandy-bottom shoreline in all of Northern Michigan! A turnkey ranch home, equally suited for year-round living or as a seasonal vacation escape, features easy single-level living with 2 bedrooms and 2 baths, set on 1.29 acres. Enjoy an expansive waterside deck and a detached garage with a framed upper level, ready to be finished for additional living space with Instagram worthy water views and a covered private balcony. The soft, sandy bottom beach is truly picture-perfect, ideal for swimming, boating, and bonfires - framed by sweeping views of Power Island and the crystal-clear turquoise waters of West Grand Traverse Bay. Lee Point Road sits in a highly sought after location just minutes from the vibrant, year-round Village of Suttons Bay and only 15 minutes to downtown Traverse City!
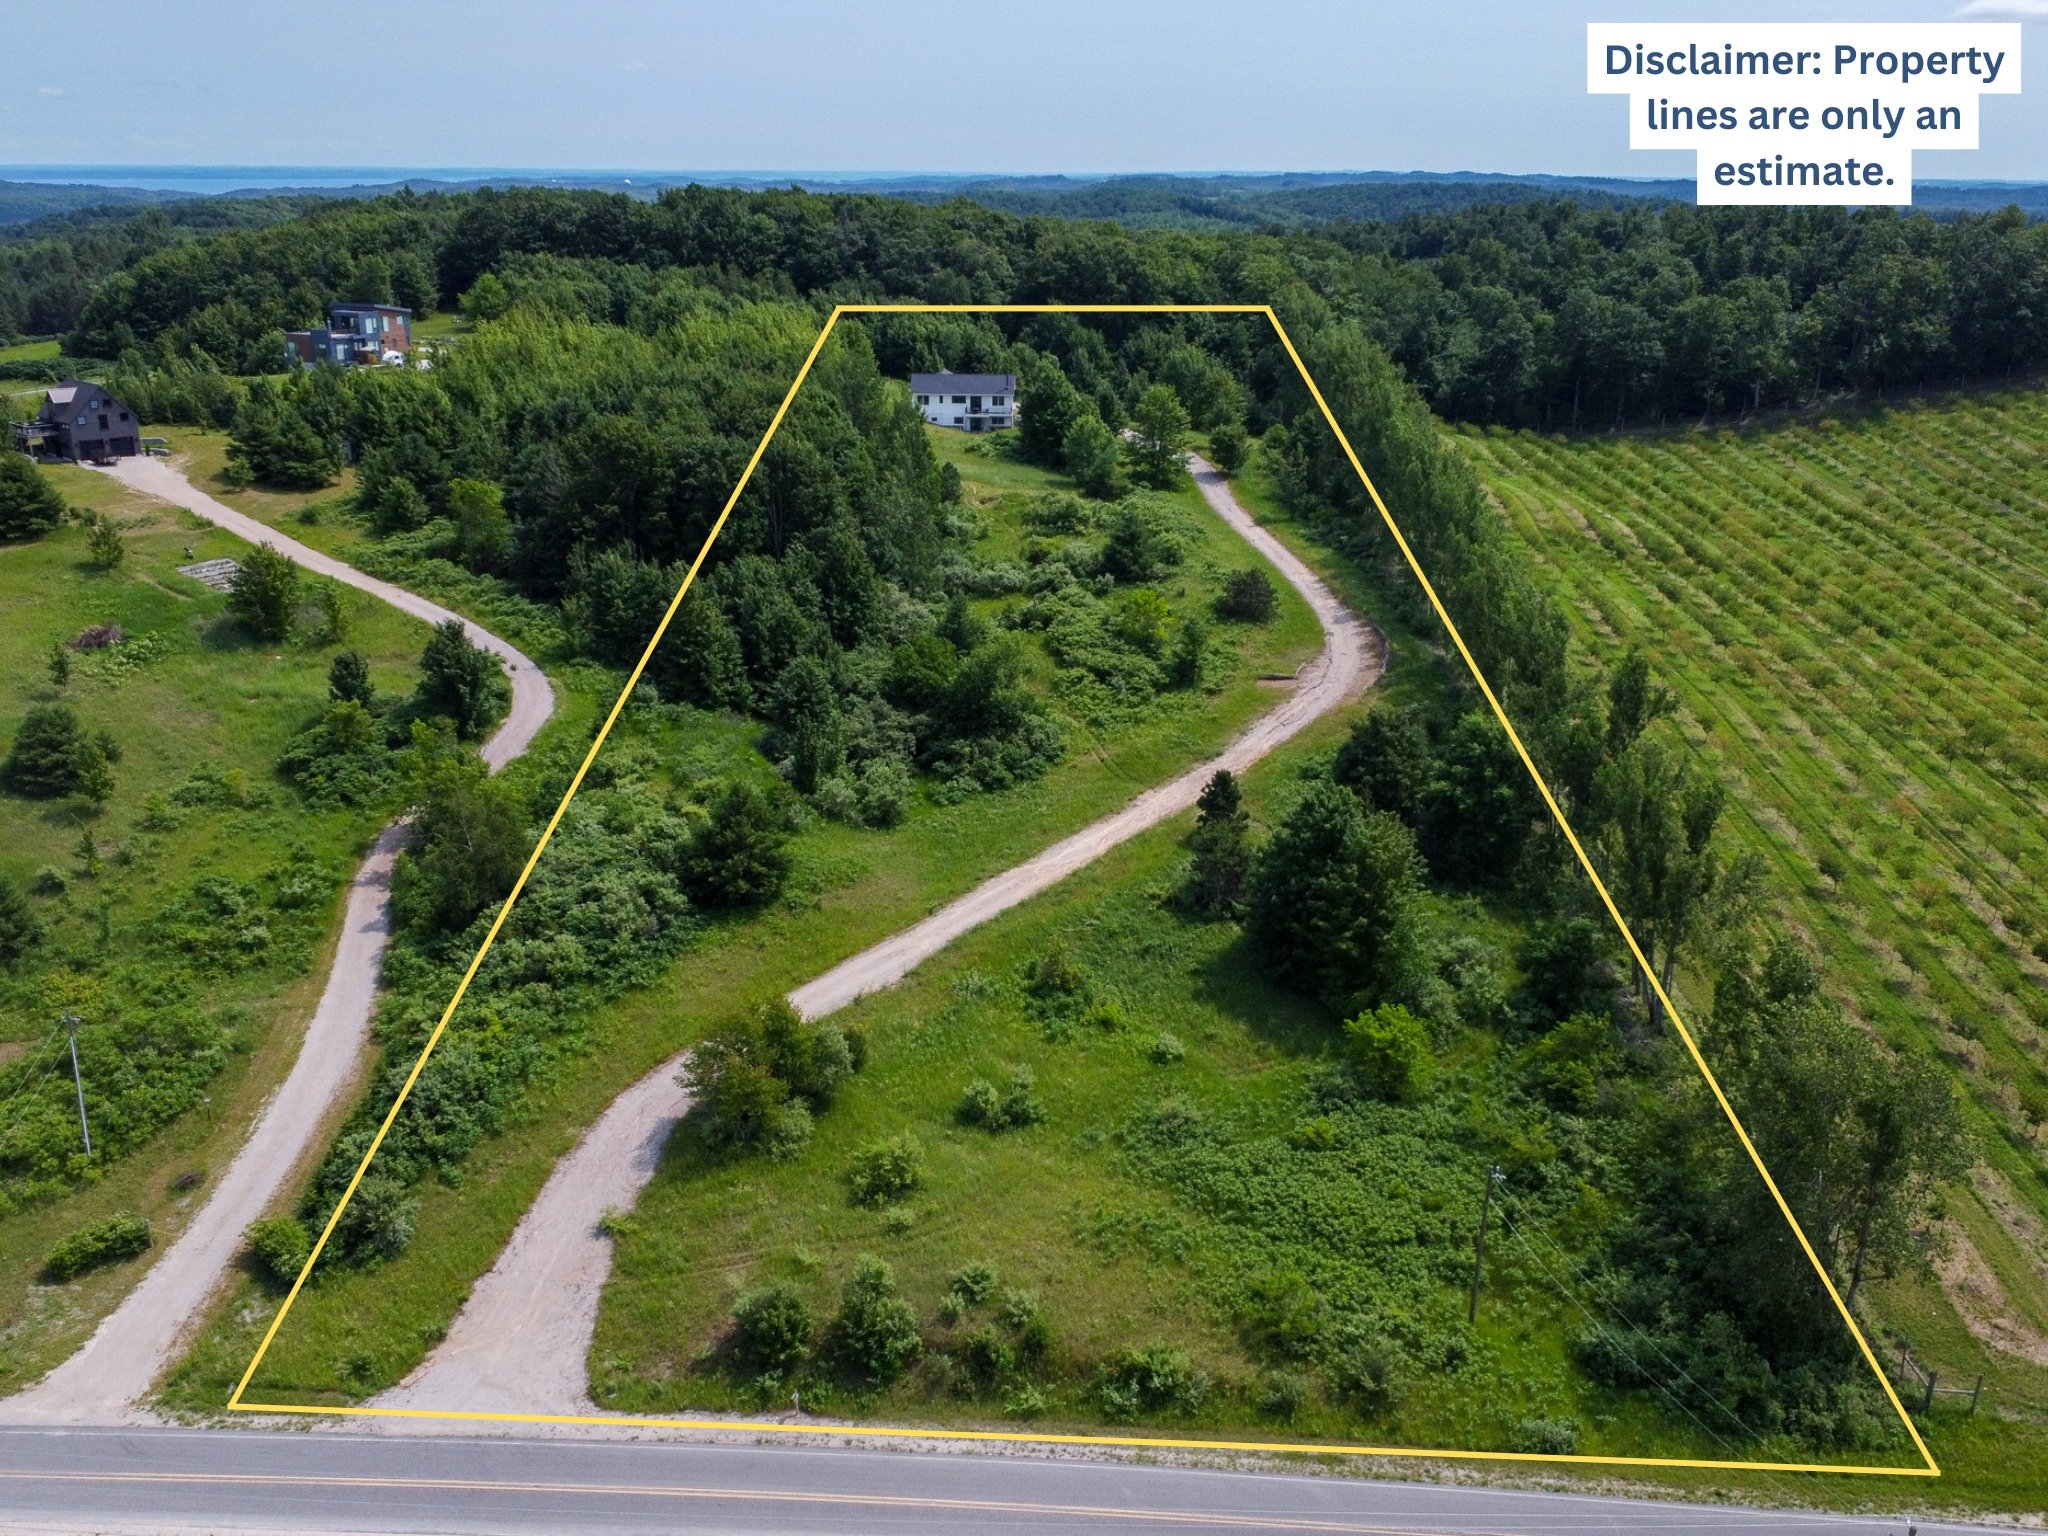
11.31 Acres – E Smiseth Road, Suttons Bay – NEW LISTING
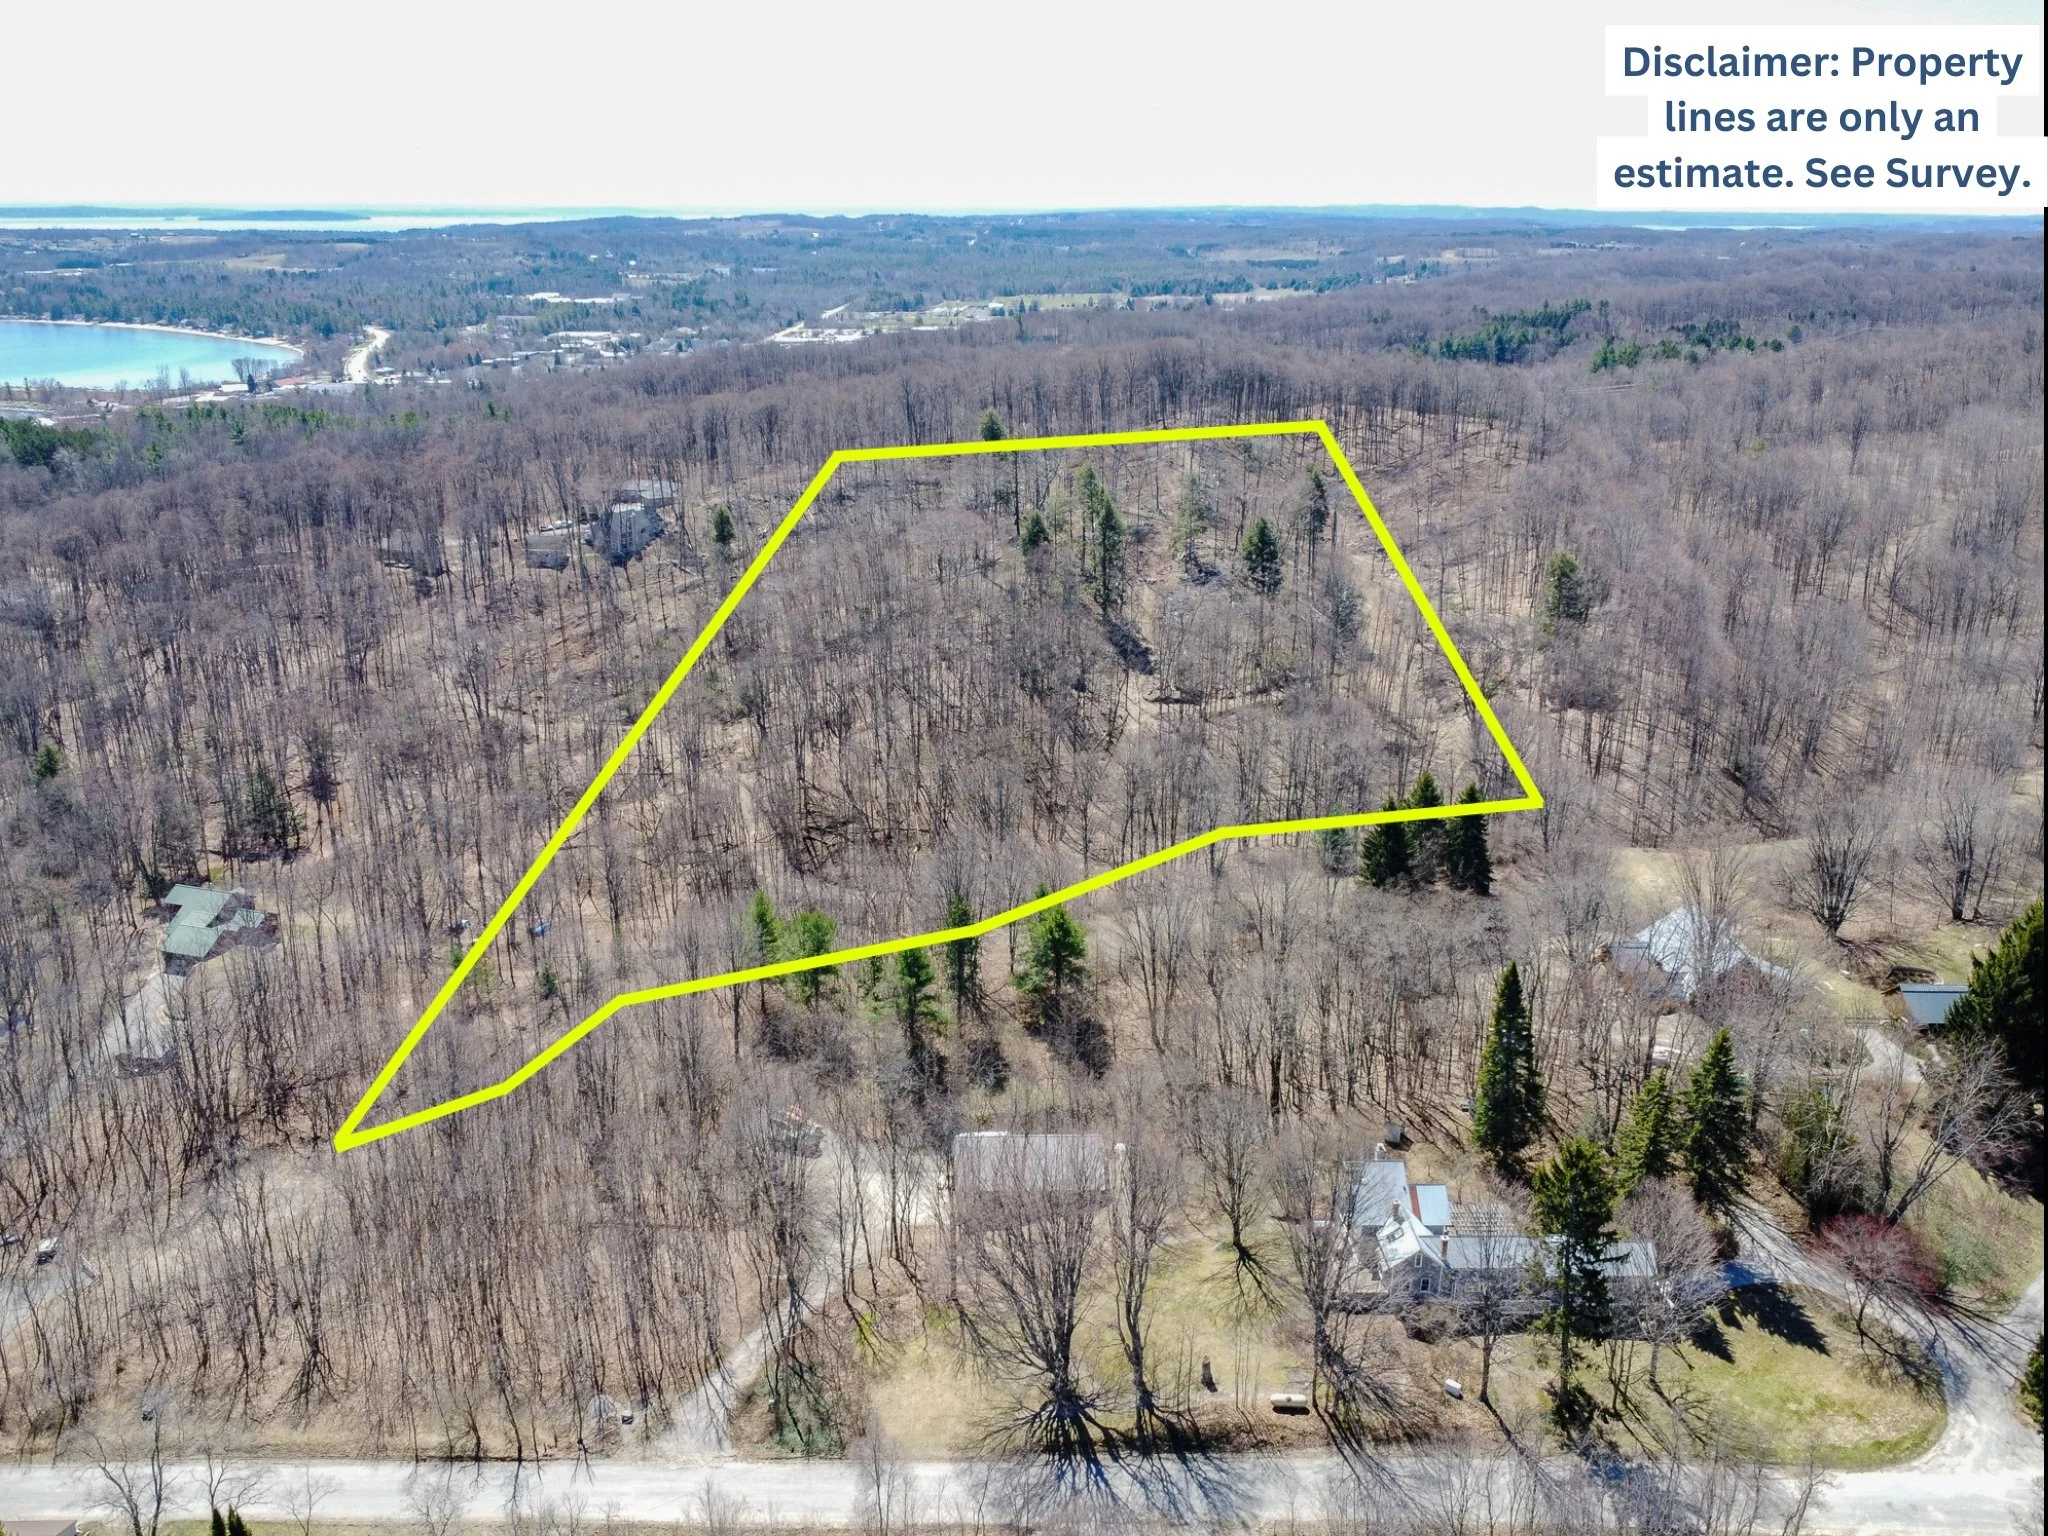
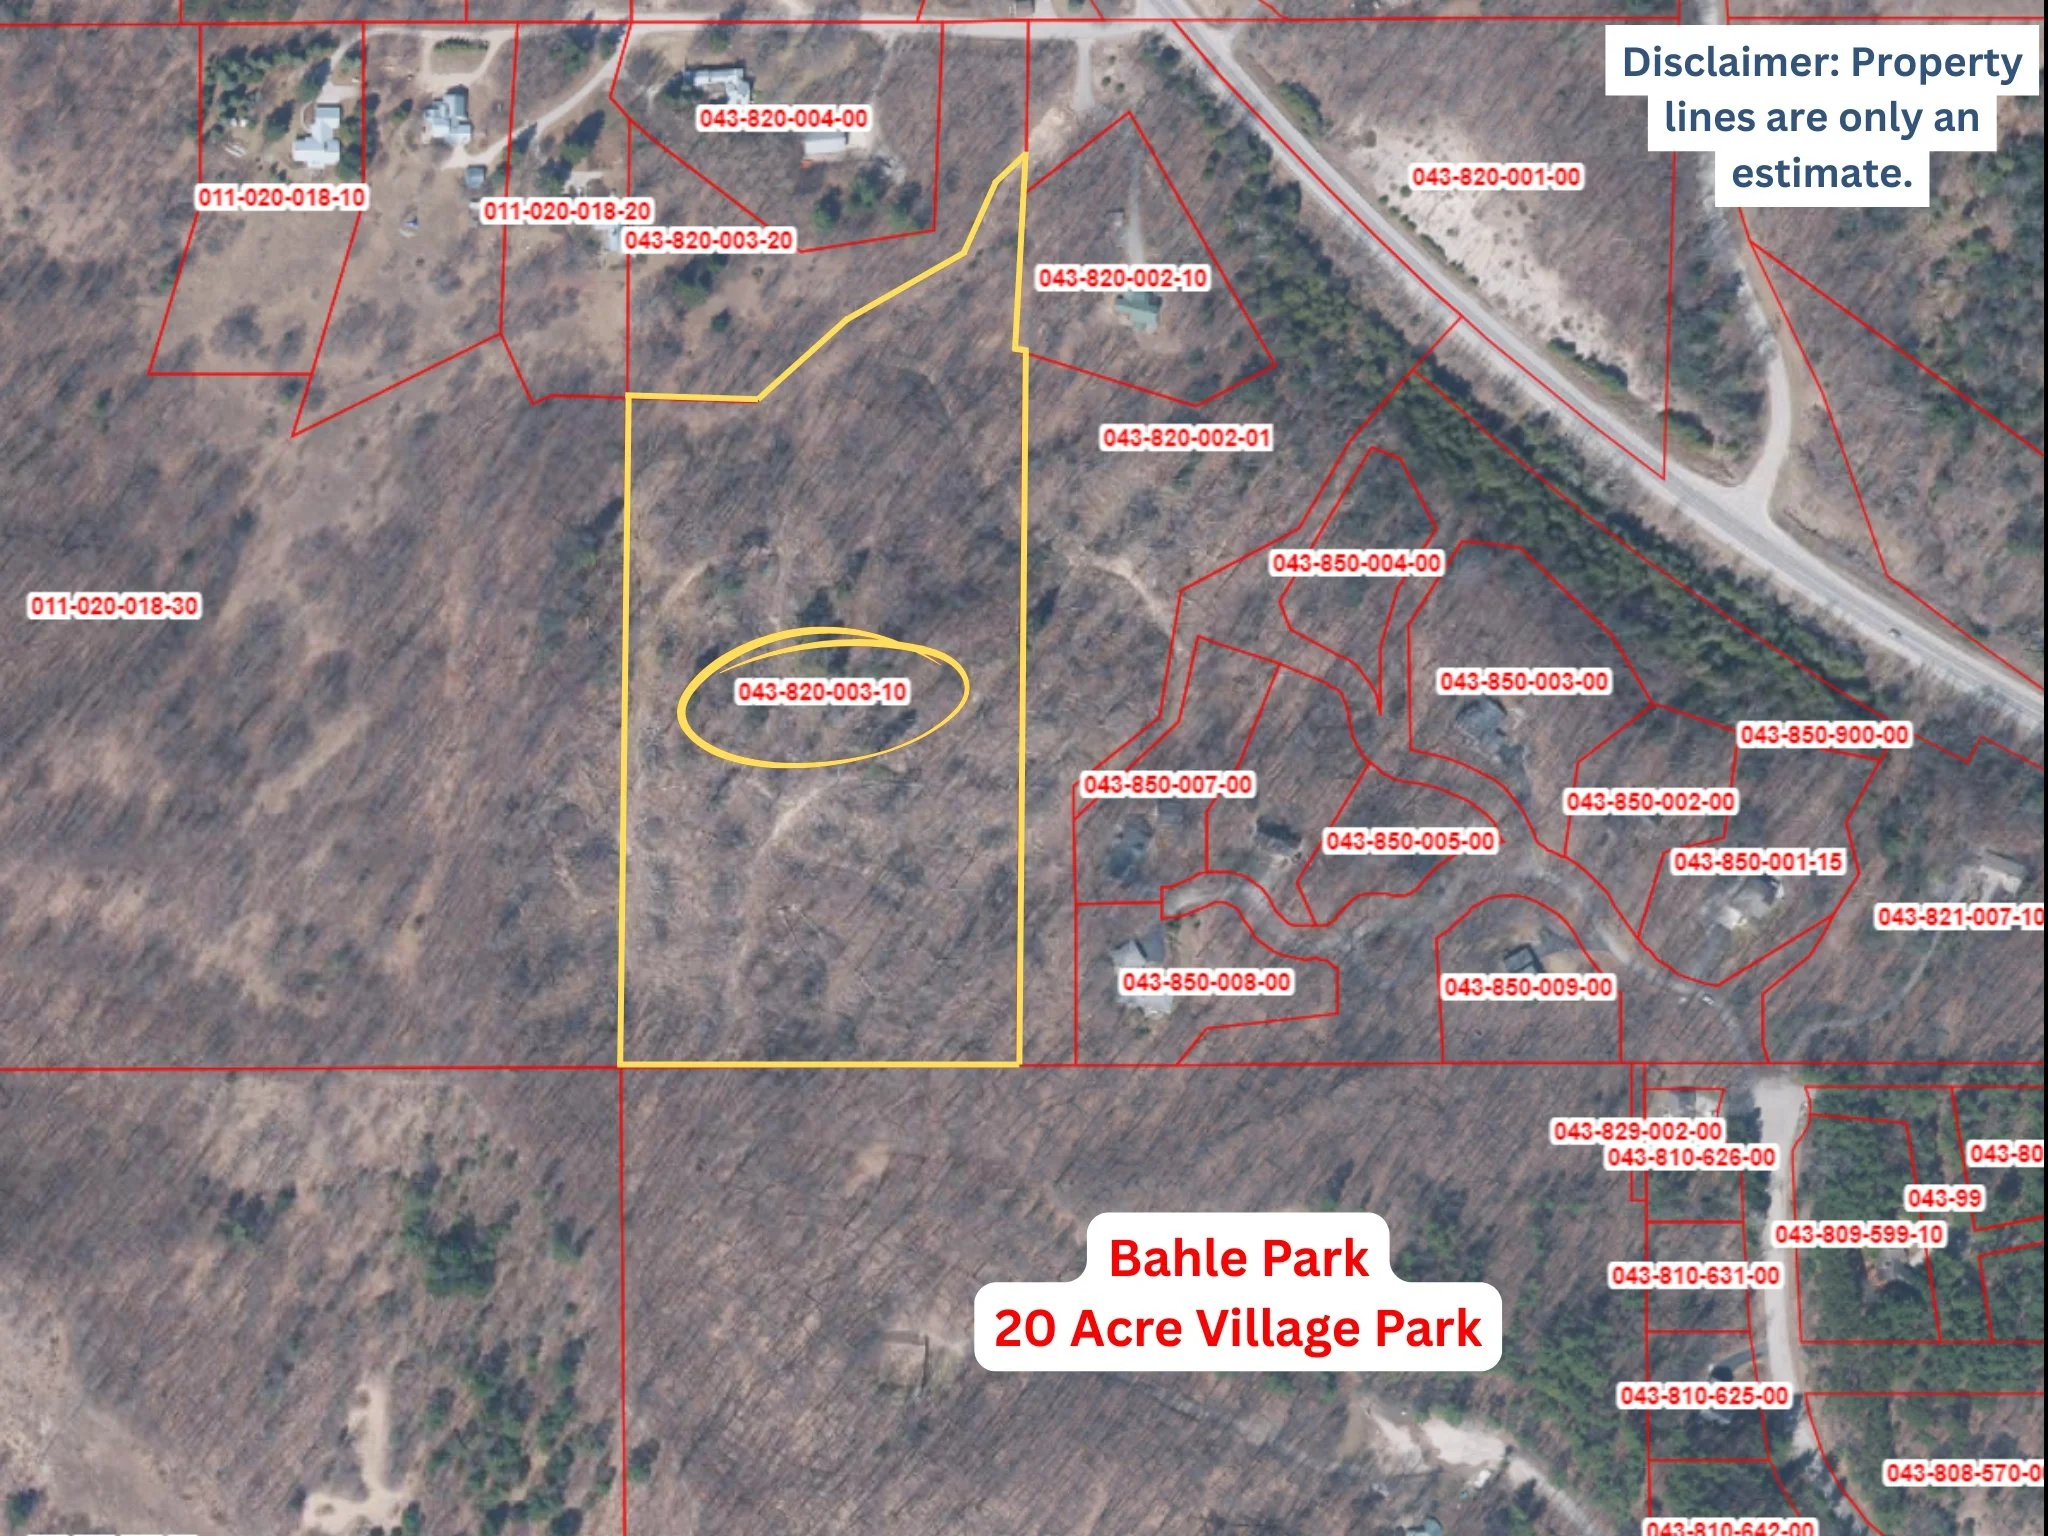


Exceptionally rare large-acreage parcel within the Village of Suttons Bay, backing directly to 20 acres of Village-owned parkland. One of only a handful of remaining Village properties of this size, this 11.31-acre wooded setting features a variety of building sites and rolling terrain that rises to a scenic elevated ridgeline with seasonal water views. No deed restrictions! Create your own private trail system and connect seamlessly to Bahle Park—offering year-round recreation with direct access to the Village through Bahle Park by foot, snowshoes, or even skis, right from your backyard. Wildlife is abundant, and a small creek meanders along the western boundary, enhancing the natural setting. A rare opportunity to secure a true legacy property with exceptional privacy, all less than 1 mile from downtown Suttons Bay!
7196 S West Bay Shore Drive, Traverse City – NEW LISTING


Perfectly positioned along scenic M-22 at the midway point between Traverse City and Suttons Bay, this beautifully maintained and thoughtfully updated home is truly move-in ready - simply unpack and enjoy an idyllic Leelanau County summer! The 3-bedroom, two-story layout features a comfortable main-floor living room, updated kitchen with quartz countertops & updated appliances, and a bright rear-facing family room overlooking a spacious backyard. An unfinished basement offers excellent potential to expand your finished living space affordably. Step outside to a professionally designed landscape with level terrain, underground irrigation, immaculate gardens, a stone patio, and mature trees. The showstopper: a one-of-a-kind golf putting green framed by greenside bunkers - perfect for any golf enthusiast. Towering pines in the front yard create a natural buffer and year-round privacy. Notable recent updates include shingles & siding (2018), main-level flooring (2018), and upper-level windows (2022), along with many more updates! A whole-home Generac generator adds peace of mind in every season. Altogether, this property delivers comfortable living, thoughtful updates, and exceptional outdoor spaces in a highly desirable Leelanau County location! Short Term Rentals allowed with township permit!
2164 N Belanger Creek Drive, Suttons Bay - NEW LISTING


Belanger Creek – Lot 8. This private, quiet parcel offers a tranquil creekside building site with Belanger Creek flowing along the rear of the lot. Situated just 3 miles from the Village of Suttons Bay, it’s tucked at the end of a paved cul-de-sac and offers underground utilities, including natural gas and high-speed cable internet. Residents enjoy 8.5 acres of common open space, 2,100 feet of creek frontage, shared pond frontage, and building restrictions that maintain high-quality construction. Outbuildings are allowed on this parcel. Adjacent parcels are also available to purchase.
2155 N Belanger Creek Drive, Suttons Bay - NEW LISTING


Belanger Creek – Lot 6. Wonderful building site offering bay views and shared creek frontage on Belanger Creek! Situated just 3 miles from the Village of Suttons Bay, it’s tucked at the end of a paved cul-de-sac and offers underground utilities, including natural gas and high-speed cable internet. Residents enjoy 8.5 acres of common open space, 2,100 feet of creek frontage, shared pond frontage, and building restrictions that maintain high-quality construction. Adjacent parcels are also available to purchase. Gently sloping topography offers various building options!
1881 N Blue Water Court, Suttons Bay - NEW LISTING


Situated towards the end of a quiet dead-end private road, this premier building site delivers the kind of water view you've been searching for! With 31 acres of preserved common space, peaceful countryside surroundings, and panoramic Suttons Bay sunrise water views, this is easily one of the best water view lots in the area. The value goes beyond the water view, owners benefit from lower township tax rates, a paved private road, and developer-installed underground electric, gas, cable, and high-speed internet. A shared propane system and common drain field are already in place, saving you real time and real money when planning your dream home. Less hassle and fewer surprise costs. Located just minutes from Suttons Bay, Leland, and Omena, you get privacy without isolation — wineries, marinas, golf, and dining are all within easy reach. If you’ve been waiting for the right view in the right location, this is it!
1101 Jefferson Ave, Traverse City – SOLD


This is the Slabtown location you’ve been looking for! This oversized 195’ x 50’ lot is one of the largest you’ll find in Downtown Traverse City’s most sought-after neighborhood. Whether you renovate the existing 2-bedroom ranch home or build from the ground up, this parcel offers tremendous potential for your vision and your investment. R-1b zoning provides flexibility, allowing for accessory dwelling units (maximum of 2 dwellings per parcel) or an accessory building, depending on your desired use. The location can’t be beat: just ½ mile to Slabtown Beach on West Bay, ¾ mile to Downtown, ¼ mile to Munson, and ½ mile to Willow Hill Elementary. If you’re looking for a rare, extra-large parcel in a premium location with room to create exactly what you want, this is it. Opportunities like this don’t come around often so don’t miss out!

Leelanau County Vacant Land Market: 2016–2025 Trends, Pricing Power, and What It Means for Buyers & Sellers
Leelanau County Vacant Land Market: 2016–2025
Trends, Pricing Power, and What It Means for Buyers & Sellers


If you’re looking at vacant land in Leelanau County, the data tells a very clear story: land is scarce, demand is persistent, and pricing power has shifted decisively toward well-located parcels.
Using Northern Great Lakes Realtors MLS data from 2016 through 2025, here’s what actually happened—and why it matters if you’re buying or selling land in Leelanau County today.
Vacant Land Sales: Fewer Deals, Not Fading Demand
From 2016 through 2019, vacant land sales were fairly stable, averaging roughly 200–240 parcels per year. Then came the pandemic-era surge:
2020: 327 parcels sold
2021: 412 parcels sold (the decade high)
That spike wasn’t random. Buyers rushed to secure land for future homes, investment, or lifestyle properties as remote work became normal and Leelanau County jumped onto the national radar.
Since then, sales volume has cooled:
2022: 278 sales
2023: 168 sales
2024: 197 sales
2025: 193 sales
Here’s the key takeaway most people miss:
📉 Lower unit sales do not mean lower demand.
They mean less inventory and more selective buyers.
Dollar Volume Tells the Real Story
Now look at the money.
Even with fewer parcels changing hands after 2021, total dollar volume stayed strong:
2021: $71.1M (record year)
2022: $47.8M
2023: $31.2M
2024: $36.7M
2025: $46.9M
In fact, 2025 dollar volume nearly matched 2022, despite 85 fewer parcels sold.
That means:
➡️ Average land prices are significantly higher than pre-2020
➡️ Buyers are paying more per parcel, especially for buildable, view, waterfront, or well-located tracts
Translation: cheap land is the unicorn. You might hear about it, but you won’t see it.
Inventory: The Silent Constraint
The inventory chart is the mic-drop moment.
From 2016 to early 2020, Leelanau County routinely had 1,000–1,300 active vacant land listings. Then the market changed—fast.
2021: Inventory collapsed
2022–2025: Inventory remained historically low, bouncing between roughly 250–450 active listings
That’s a 60–75% reduction compared to pre-pandemic levels.
And here’s why that matters:
Fewer sellers are willing to let land go
Builders and long-term owners are holding
Desirable parcels are absorbed quickly when priced right
Low inventory is the real reason prices are holding—not speculation, not hype.
What This Means if You’re Buying Vacant Land
If you’re a buyer in Leelanau County:
You need to move faster than pre-2020 norms
“Waiting for prices to crash” hasn’t been a winning strategy
Buildable land with utilities, road frontage, or views is still commanding premiums
Smart buyers are focusing on:
Parcels with realistic building potential
Zoning and setback clarity
Long-term utility, not just acreage count
What This Means if You’re Selling Vacant Land
If you own vacant land, this is not the market to underprice—or overprice.
The data suggests:
Well-positioned parcels sell, even in slower years
Pricing accuracy matters more than ever
Buyers are sophisticated and expect strong value, not guesswork
The biggest mistake sellers make?
❌ Relying on outdated comps from pre-2020 inventory levels.
The Bottom Line on Leelanau County Vacant Land
From 2016 to 2025, Leelanau County’s vacant land market transformed:
Fewer listings
Fewer total transactions
Higher average prices
Sustained demand
This is no longer a high-volume land market—it’s a precision market. The winners are the buyers and sellers who understand the numbers, not the noise.
If you’re thinking about buying or selling vacant land in Leelanau County, the data doesn’t just help—it protects you from costly assumptions.
Thinking About Vacant Land in Leelanau County?
Whether you’re looking for a home site, an investment parcel, or you’re sitting on land and wondering what it’s worth in today’s market, having a hyper-local perspective matters.
I track this data closely because in a market like Leelanau County, details decide outcomes.
If you want a straight answer—not a sales pitch—I’m always happy to talk land.
Need Expert Real Estate Advice in Leelanau County or Suttons Bay? Contact Jonathan Oltersdorf Today!
For personalized insights into Leelanau County real estate, reach out to Jonathan Oltersdorf at Oltersdorf Realty, LLC.
📞 Office Phone: 231-271-7777
📧 Email: jonathan@oltersdorf.com
🌐 Website: www.oltersdorf.com
Leelanau County Principal Residence Exemption Trends (2010–2025): What the Data Really Tells Us
Leelanau County Principal Residence Exemption Trends (2010–2025): What the Data Really Tells Us
If you’re trying to understand who actually lives in Leelanau County—versus who owns vacation or investment property—the Principal Residence Exemption (PRE) is one of the most important data points available.
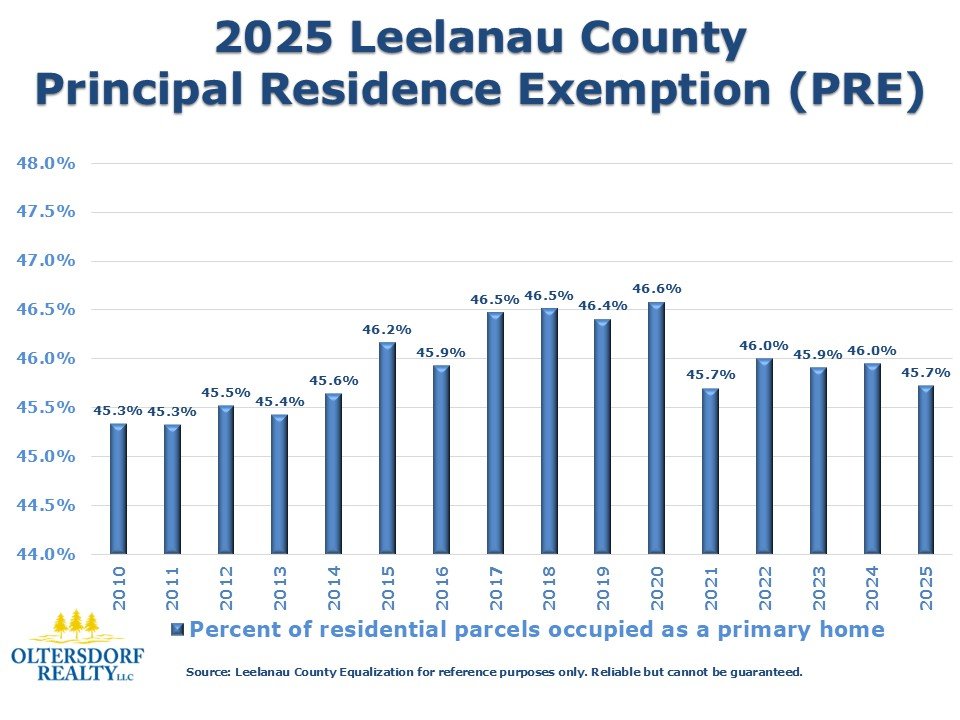
The chart above shows the percentage of residential parcels occupied as a primary home in Leelanau County from 2010 through 2025, based on Equalization Department data. And while the year-to-year changes may look small, the long-term trend tells a bigger story about housing pressure, second-home ownership, and inventory constraints.
What Is the Principal Residence Exemption (PRE)?
In Michigan, a Principal Residence Exemption indicates that a property is the owner’s primary residence. Homes with a PRE are typically occupied year-round by local residents, while parcels without a PRE are often:
Seasonal or vacation homes
Short-term or long-term rentals
Investment properties
Second homes owned by out-of-area buyers
Tracking PRE percentages is one of the best ways to measure how much of a community’s housing stock is truly serving full-time residents.
Key Takeaways from the 2010–2025 Leelanau County PRE Data
1. Less than half of all parcels are primary residences
Throughout the entire 15-year period shown, the PRE rate stays in a narrow range—roughly 45% to 47%. That means a majority of residential parcels in Leelanau County are not occupied full-time.
This is a defining characteristic of the local real estate market and a major reason inventory remains tight even when sales slow.
2. The peak occurred around 2017–2020
PRE percentages climbed steadily from 2010 and peaked around 2017–2020, topping out near 46.6%. This period coincides with:
Strong in-migration before and during the early COVID years
Buyers converting second homes into primary residences
Increased remote work flexibility
3. A post-2020 pullback reflects market reality
After 2020, the PRE percentage dips slightly and stabilizes again in the mid-45% range. This suggests:
Continued demand for seasonal and second homes
Investors and lifestyle buyers remaining active
Fewer homes converting to full-time residences than many expect
Despite record-setting sales activity earlier this decade, Leelanau County has not shifted into a majority full-time resident market.
Why PRE Trends Matter for Buyers and Sellers
For Buyers:
Low PRE percentages mean you’re competing in a market with:
Fewer owner-occupied listings
Higher competition for year-round homes
Zoning and rental rules that matter more than in typical markets
Understanding PRE data helps buyers set realistic expectations and make smarter offers.
For Sellers:
Homes that work well as primary residences often attract a different buyer pool than vacation or rental-focused properties. Knowing where demand actually comes from can directly affect pricing, timing, and marketing strategy.
For Policy and Long-Term Planning:
PRE data also plays a role in conversations about workforce housing, school enrollment, and local services—topics that continue to shape Leelanau County’s future.
Bottom Line
Leelanau County’s real estate market is not driven primarily by year-round residents—and the data proves it. For more than a decade, over half of all residential parcels have been non-primary residences, and that reality continues in 2025.
Anyone buying, selling, or investing here needs to understand this dynamic. It impacts values, inventory, negotiations, and long-term appreciation.
Want Local Data That Actually Matters?
I regularly analyze Leelanau County real estate trends, including sales, financing, cash purchases, and housing use patterns like PRE. If you want data-driven insight instead of national headlines, you’re in the right place.
Need Expert Real Estate Advice? Contact Jonathan Oltersdorf Today!
For personalized insights into Leelanau County real estate, reach out to Jonathan Oltersdorf at Oltersdorf Realty, LLC.
📞 Office Phone: 231-271-7777
📧 Email: jonathan@oltersdorf.com
🌐 Website: www.oltersdorf.com
Leelanau County Home Prices vs the S&P 500 (2010–2025): Real Estate as a Long-Term Investment
Leelanau County Home Prices vs the S&P 500 (2010–2025): Real Estate as a Long-Term Investment
The chart above compares Leelanau County home prices—both average and median sales prices—against the S&P 500 Index year-end values from 2010 through 2025.
Why compare housing to the stock market? Because many buyers and sellers ask the same question every year:
“Would I be better off putting my money in the market instead of real estate?”
OR
”Should I buy real estate from my stock market profits?”
This data-driven comparison helps answer that—specifically for Leelanau County, not the national averages that rarely reflect our local reality.
What the Chart Shows
This chart tracks three key metrics over 15 years:
Average Leelanau County sales price
Median Leelanau County sales price
S&P 500 Index year-end price
While these numbers measure different asset classes, they reveal how local real estate has performed alongside one of the most commonly referenced investment benchmarks.
Key Takeaways from 2010–2025
1. Leelanau County home prices show steady, long-term appreciation
From 2010 to 2025, both average and median home prices in Leelanau County trend consistently upward. Growth wasn’t perfectly smooth—no real asset ever is—but the long-term direction is clear.
This steady climb reflects:
Limited inventory
Strong second-home and lifestyle demand
A market less tied to short-term economic shocks
Real estate here behaves more like a scarcity asset than a speculative one.
2. Housing volatility is meaningfully different than the stock market
The S&P 500 experiences sharper rises and drops, including:
Rapid growth years
Short-term pullbacks
Emotional reaction cycles
Leelanau County home prices, by contrast, show less volatility and fewer dramatic swings.
That matters for:
Risk-averse investors
Homeowners focused on long-term equity
Buyers prioritizing stability over short-term gains
Real estate as an inflation hedge
Housing doesn’t spike like stocks—but it also doesn’t whipsaw the same way.
3. The 2020–2022 period changed the trajectory
Both asset classes accelerated after 2020, but local housing saw:
A surge in demand from remote workers
Increased migration from urban markets
Buyers converting second homes into primary residences
While the stock market experienced notable ups and downs after that surge, Leelanau County home values held their ground, reinforcing the market’s structural demand.
4. Median vs. average price trends matter
The median price rising alongside the average price signals broad-based appreciation—not just growth driven by luxury sales.
That tells us:
Appreciation wasn’t limited to top-tier waterfront homes
Demand pushed through multiple price brackets
The market strength wasn’t isolated to a few outliers
This is a key indicator of healthy price growth.
What This Means for Buyers, Sellers, and Investors
For Buyers:
Trying to time the Leelanau County market like stocks rarely works. Long-term buyers who focus on lifestyle, use, and holding power tend to benefit most.
For Sellers:
Price support here is structural, not speculative. Even during slower sales cycles, values don’t unwind the way overheated metro markets sometimes do.
For Investors:
Leelanau County real estate behaves less like a trading asset and more like a long-duration hold—with appreciation driven by geography, zoning, and limited supply.
Leelanau County Is Not a Wall Street Trade
This comparison makes one thing clear:
Leelanau County housing doesn’t move like the S&P 500—and that’s the point.
Stocks react quickly. Real estate here moves deliberately. And for many owners, that slower, steadier path has proven just as powerful over time—especially when paired with use, rental income, or tax advantages.
Want Local Market Data That Actually Applies Here?
I regularly analyze Leelanau County home prices, sales trends, financing patterns, and long-term market signals using local MLS and county data—not national headlines.
If you’re buying, selling, or simply trying to understand where this market fits in a bigger financial picture, local data beats generic advice every time.
Need Expert Real Estate Advice? Contact Jonathan Oltersdorf Today!
For personalized insights into Leelanau County real estate, reach out to Jonathan Oltersdorf at Oltersdorf Realty, LLC.
📞 Office Phone: 231-271-7777
📧 Email: jonathan@oltersdorf.com
🌐 Website: www.oltersdorf.com