


Step onto one of South Lake Leelanau’s most coveted stretches of shoreline featuring 100’ of private direct sandy bottom frontage and spectacular western facing sunsets over the lake! Sold fully furnished, this 3-bedroom, 3-bath cottage (with a non-conforming 4th bedroom) offers approximately 1,800 sq feet of comfortable one-level living, The open living room/kitchen showcases lake views and features a charming wood burning fireplace. Additional features include a spacious waterside primary suite, main floor laundry room, an attached 2.5+ car garage, 2-car carport, and a large unfinished basement providing plenty of storage space. Situated on low-traffic S Lakeview Road, the property is just 10–15 minutes from Downtown Traverse City in Elmwood Township, where short-term rentals are permitted with township approval, making this an attractive option for your personal use or as an investment property. Soak up summer on the waterside deck perfect for entertaining, relaxing, and creating unforgettable lakeside memories. The naturally preserved shoreline has been recognized by the Lake Association as a model example of healthy, natural lakefront stewardship and is featured on educational shoreline tours. Don’t miss this exceptional opportunity on Lake Leelanau!
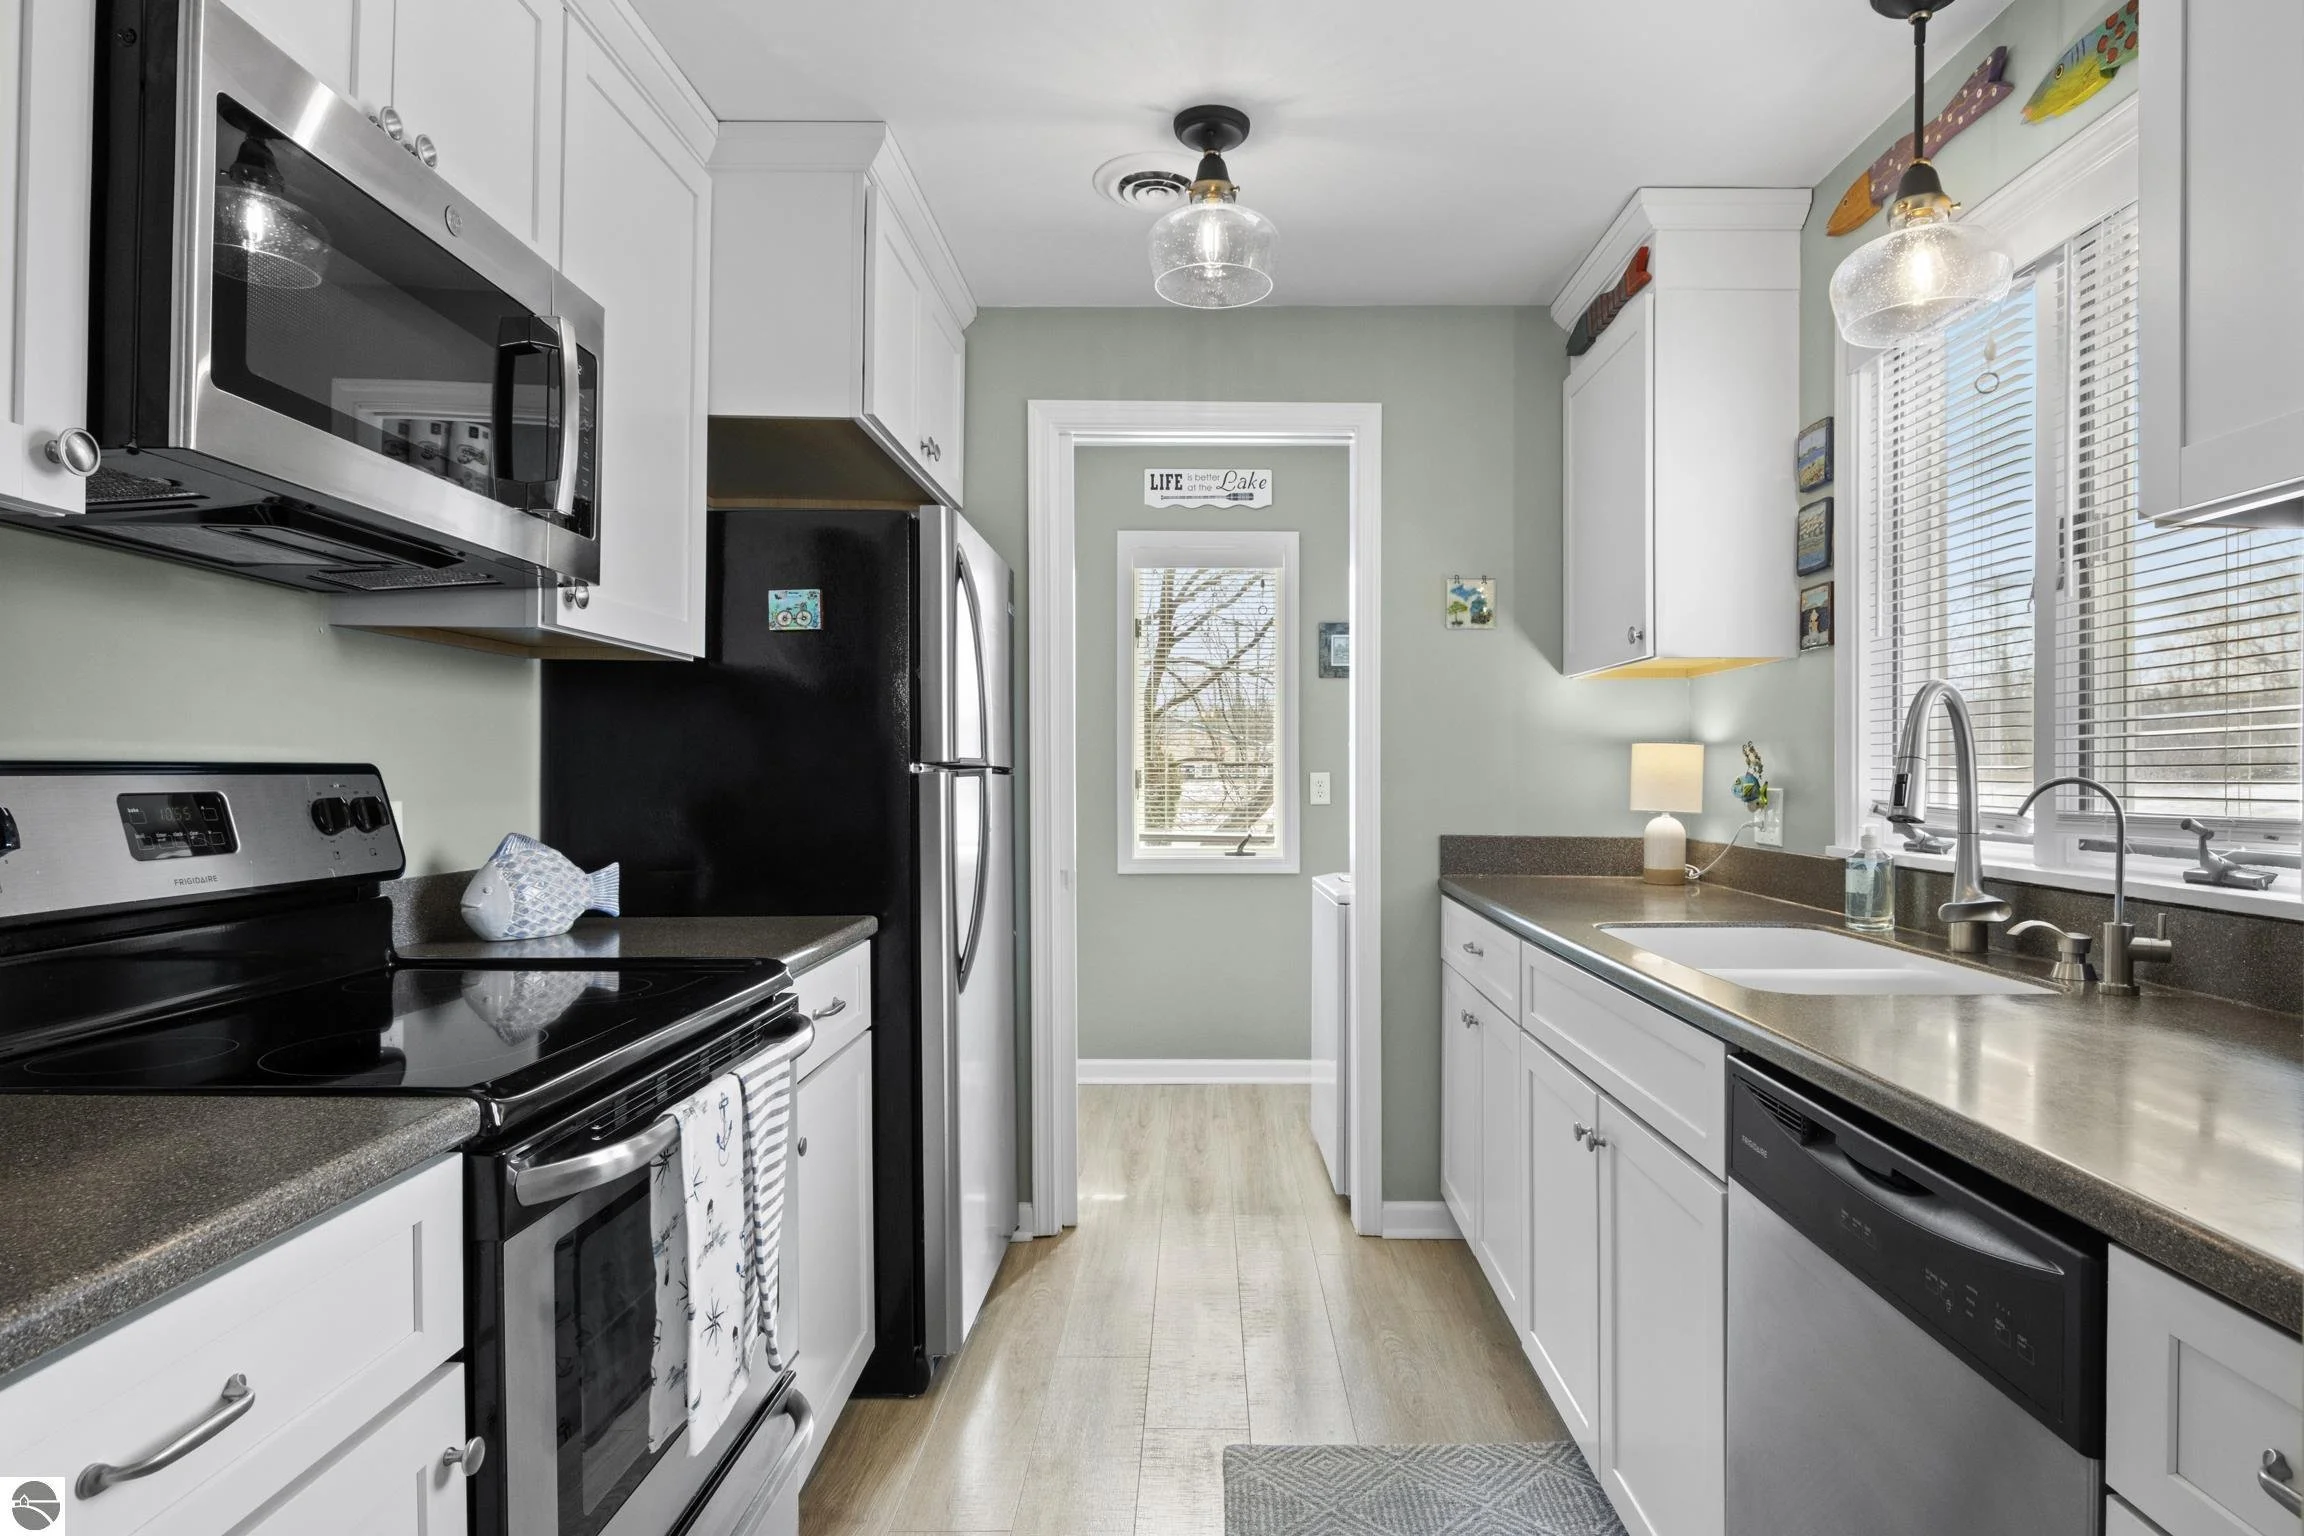
7196 S West Bay Shore Drive, Traverse City – SOLD
SOLD TRAVERSE CITY HOME
LISTING SOLD by Oltersdorf Realty LLC on 7/24/26
$495,000 – 7196 S West Bay Shore Drive, Traverse City, MI – 3 Bedroom Home with Extensive Updates & Beautiful Landscaping!


Perfectly positioned along scenic M-22 at the midway point between Traverse City and Suttons Bay, this beautifully maintained and thoughtfully updated home is truly move-in ready - simply unpack and enjoy an idyllic Leelanau County summer! The 3-bedroom, two-story layout features a comfortable main-floor living room, updated kitchen with quartz countertops & updated appliances, and a bright rear-facing family room overlooking a spacious backyard. An unfinished basement offers excellent potential to expand your finished living space affordably. Step outside to a professionally designed landscape with level terrain, underground irrigation, immaculate gardens, a stone patio, and mature trees. The showstopper: a one-of-a-kind golf putting green framed by greenside bunkers - perfect for any golf enthusiast. Towering pines in the front yard create a natural buffer and year-round privacy. Notable recent updates include shingles & siding (2018), main-level flooring (2018), and upper-level windows (2022), along with many more updates! A whole-home Generac generator adds peace of mind in every season. Altogether, this property delivers comfortable living, thoughtful updates, and exceptional outdoor spaces in a highly desirable Leelanau County location! Short Term Rentals allowed with township permit!
Lot 61 - S Skye Hill Drive, Traverse City - NEW LISTING


Centrally located between Traverse City and Suttons Bay in the desirable Leelanau Highlands development, this 0.89-acre vacant building site offers a beautiful, wooded, hilltop setting with privacy and scenic surroundings. The property backs to HOA common area, providing additional separation from neighboring parcels. The gently sloping terrain creates a unique opportunity for a home designed to take advantage of the natural landscape with a walkout possible in 3 directions. The ability to connect to the community septic system (connection fee paid by current owner) helps simplify the building process and reduce construction costs. Underground utilities, natural gas, and cable are available. Enjoy convenient access to nearby public boat launches, the Leelanau Trail, and all the amenities of both Traverse City and Suttons Bay. A great opportunity to build your Northern Michigan dream home in a peaceful, private setting, surrounded by upscale residences, including $1+ million homes!
8282 S Center Highway, Traverse City - SOLD
SOLD ELMWOOD TOWNSHIP HOME
SOLD by Oltersdorf Realty LLC on 7/7/2026
$549,900 Ask Price
JUST SOLD in Elmwood Township, Traverse City | $549,900 Ask Price – 8282S Center Highway, Traverse City, MI - 4 Bedroom, 2.5 bath 2 story home on 6.38 acres in Leelanau County! Includes adjacent build-able lot! Buyer Agent -> Jonathan Oltersdorf, Oltersdorf Realty.


3378 Silver Farms Lane, Traverse City - SOLD
SOLD TRAVERSE CITY 2 STORY HOME
SOLD by Oltersdorf Realty LLC on 5/15/2026
$710,000 Ask Price
JUST SOLD in Silver Farms, Traverse City | 3378 Silver Farms, Traverse City, MI – 3 Bedroom, 3.5 Bath, 3,100 sq ft 2 story home on 0.60 acres in Silver Farms, close to Downtown Traverse City! Buyer Agent -> Jonathan Oltersdorf, Oltersdorf Realty.
1101 Jefferson Ave, Traverse City – SOLD


This is the Slabtown location you’ve been looking for! This oversized 195’ x 50’ lot is one of the largest you’ll find in Downtown Traverse City’s most sought-after neighborhood. Whether you renovate the existing 2-bedroom ranch home or build from the ground up, this parcel offers tremendous potential for your vision and your investment. R-1b zoning provides flexibility, allowing for accessory dwelling units (maximum of 2 dwellings per parcel) or an accessory building, depending on your desired use. The location can’t be beat: just ½ mile to Slabtown Beach on West Bay, ¾ mile to Downtown, ¼ mile to Munson, and ½ mile to Willow Hill Elementary. If you’re looking for a rare, extra-large parcel in a premium location with room to create exactly what you want, this is it. Opportunities like this don’t come around often so don’t miss out!

Leelanau County Vacant Land Market: 2016–2025 Trends, Pricing Power, and What It Means for Buyers & Sellers
Leelanau County Vacant Land Market: 2016–2025
Trends, Pricing Power, and What It Means for Buyers & Sellers


If you’re looking at vacant land in Leelanau County, the data tells a very clear story: land is scarce, demand is persistent, and pricing power has shifted decisively toward well-located parcels.
Using Northern Great Lakes Realtors MLS data from 2016 through 2025, here’s what actually happened—and why it matters if you’re buying or selling land in Leelanau County today.
Vacant Land Sales: Fewer Deals, Not Fading Demand
From 2016 through 2019, vacant land sales were fairly stable, averaging roughly 200–240 parcels per year. Then came the pandemic-era surge:
2020: 327 parcels sold
2021: 412 parcels sold (the decade high)
That spike wasn’t random. Buyers rushed to secure land for future homes, investment, or lifestyle properties as remote work became normal and Leelanau County jumped onto the national radar.
Since then, sales volume has cooled:
2022: 278 sales
2023: 168 sales
2024: 197 sales
2025: 193 sales
Here’s the key takeaway most people miss:
📉 Lower unit sales do not mean lower demand.
They mean less inventory and more selective buyers.
Dollar Volume Tells the Real Story
Now look at the money.
Even with fewer parcels changing hands after 2021, total dollar volume stayed strong:
2021: $71.1M (record year)
2022: $47.8M
2023: $31.2M
2024: $36.7M
2025: $46.9M
In fact, 2025 dollar volume nearly matched 2022, despite 85 fewer parcels sold.
That means:
➡️ Average land prices are significantly higher than pre-2020
➡️ Buyers are paying more per parcel, especially for buildable, view, waterfront, or well-located tracts
Translation: cheap land is the unicorn. You might hear about it, but you won’t see it.
Inventory: The Silent Constraint
The inventory chart is the mic-drop moment.
From 2016 to early 2020, Leelanau County routinely had 1,000–1,300 active vacant land listings. Then the market changed—fast.
2021: Inventory collapsed
2022–2025: Inventory remained historically low, bouncing between roughly 250–450 active listings
That’s a 60–75% reduction compared to pre-pandemic levels.
And here’s why that matters:
Fewer sellers are willing to let land go
Builders and long-term owners are holding
Desirable parcels are absorbed quickly when priced right
Low inventory is the real reason prices are holding—not speculation, not hype.
What This Means if You’re Buying Vacant Land
If you’re a buyer in Leelanau County:
You need to move faster than pre-2020 norms
“Waiting for prices to crash” hasn’t been a winning strategy
Buildable land with utilities, road frontage, or views is still commanding premiums
Smart buyers are focusing on:
Parcels with realistic building potential
Zoning and setback clarity
Long-term utility, not just acreage count
What This Means if You’re Selling Vacant Land
If you own vacant land, this is not the market to underprice—or overprice.
The data suggests:
Well-positioned parcels sell, even in slower years
Pricing accuracy matters more than ever
Buyers are sophisticated and expect strong value, not guesswork
The biggest mistake sellers make?
❌ Relying on outdated comps from pre-2020 inventory levels.
The Bottom Line on Leelanau County Vacant Land
From 2016 to 2025, Leelanau County’s vacant land market transformed:
Fewer listings
Fewer total transactions
Higher average prices
Sustained demand
This is no longer a high-volume land market—it’s a precision market. The winners are the buyers and sellers who understand the numbers, not the noise.
If you’re thinking about buying or selling vacant land in Leelanau County, the data doesn’t just help—it protects you from costly assumptions.
Thinking About Vacant Land in Leelanau County?
Whether you’re looking for a home site, an investment parcel, or you’re sitting on land and wondering what it’s worth in today’s market, having a hyper-local perspective matters.
I track this data closely because in a market like Leelanau County, details decide outcomes.
If you want a straight answer—not a sales pitch—I’m always happy to talk land.
Need Expert Real Estate Advice in Leelanau County or Suttons Bay? Contact Jonathan Oltersdorf Today!
For personalized insights into Leelanau County real estate, reach out to Jonathan Oltersdorf at Oltersdorf Realty, LLC.
📞 Office Phone: 231-271-7777
📧 Email: jonathan@oltersdorf.com
🌐 Website: www.oltersdorf.com
What and Where Leelanau County Homebuyers Purchased in 2025
What and Where Leelanau County Homebuyers Purchased in 2025
A Data-Driven Look at Buyer Preferences and Sales Volume
Leelanau County real estate in 2025 told a clear story: buyers were selective, values remained strong, and demand extended well beyond just waterfront trophy homes. By analyzing MLS sales data from 2025, we can break down what types of homes buyers purchased and which townships captured the most sales volume across the county.
If you’re thinking about buying or selling in Leelanau County, this data matters—because it shows where buyers actually put their money.
What Leelanau County Homebuyers Bought in 2025
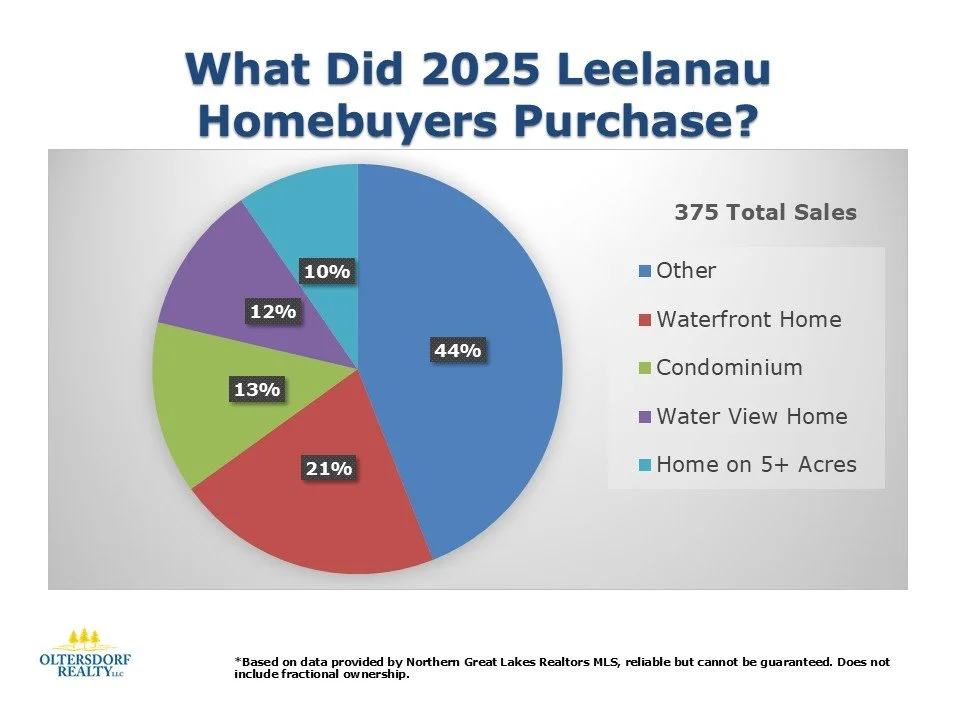
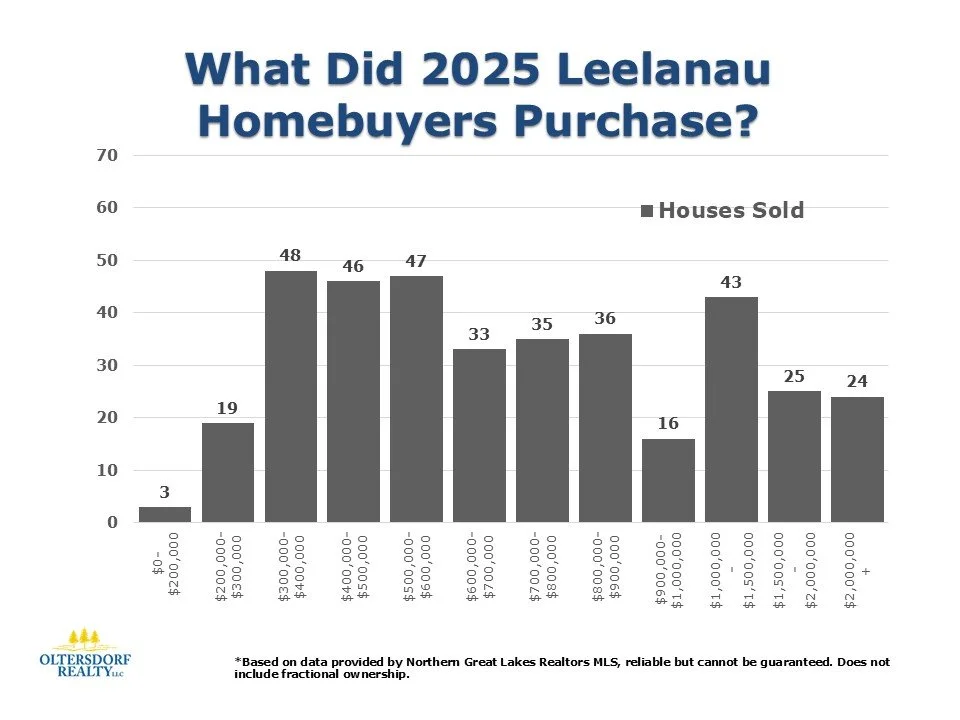
In 2025, 375 residential properties closed across Leelanau County. The breakdown of what buyers purchased highlights a surprisingly diversified market.
🏡 2025 Leelanau County Homebuyer Property Types
44% – Other Residential Homes
(Primary residences, inland homes, village properties, and non-waterfront single-family homes)21% – Waterfront Homes
Still highly desirable, but no longer dominating the market like they did during the pandemic surge.13% – Condominiums
Low-maintenance living continues to attract second-home buyers, retirees, and investors.12% – Water View Homes
Buyers are clearly willing to trade direct frontage for views—at a more approachable price point.10% – Homes on 5+ Acres
Privacy, woods, and elbow room remain in demand, especially among full-time residents.
Key Takeaway
Despite Leelanau County’s reputation for luxury waterfront real estate, nearly half of all buyers purchased “non-waterfront” homes. The market in 2025 rewarded flexibility—not just shoreline.
Where Buyers Spent Their Money in Leelanau County
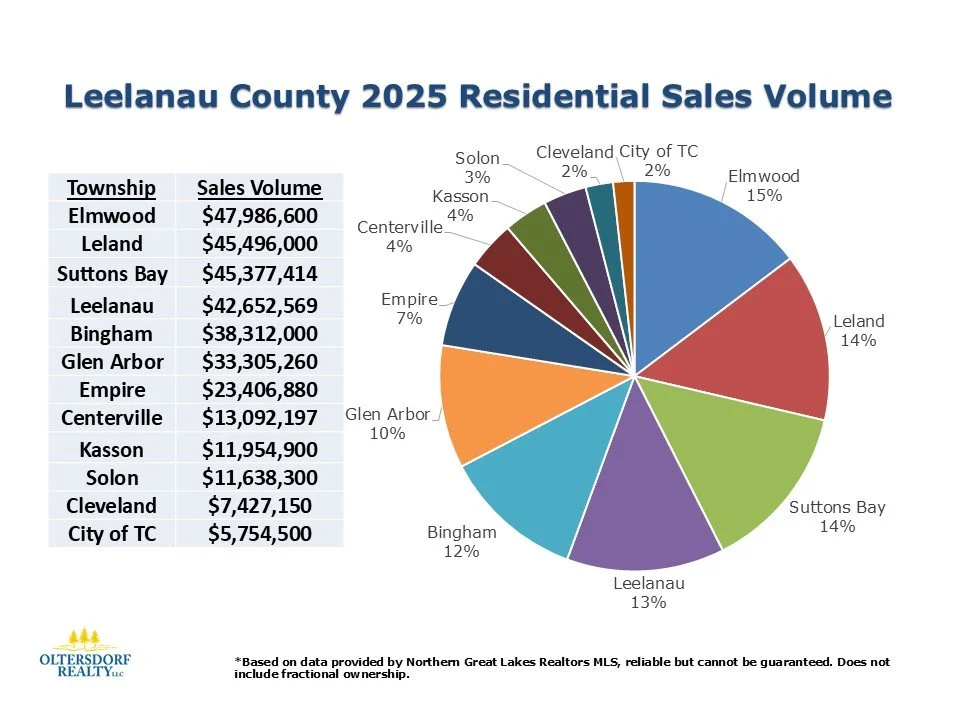
Looking at sales volume by township gives us a clearer picture of where demand—and pricing power—was strongest.
💰 Leelanau County 2025 Residential Sales Volume by Township
Township Sales Volume
Elmwood Township $47,986,600
Leland Township $45,496,000
Suttons Bay Township $45,377,414
Leelanau Township $42,652,569
Bingham Township $38,312,000
Glen Arbor Township $33,305,260
Empire Township $23,406,880
Centerville Township $13,092,197
Kasson Township $11,954,900
Solon Township $11,638,300
Cleveland $7,427,150
City of Traverse City $5,754,500
Township Market Insights
Elmwood Township led the county in total sales volume, benefiting from proximity to Traverse City, newer housing stock, and strong year-round demand.
Leland, Suttons Bay, and Leelanau Townships formed a tight cluster just behind Elmwood—proof that village-based living and water access remain powerful drivers.
Glen Arbor and Empire continued to perform well despite limited inventory, reinforcing long-term value in west-side Leelanau.
Lower-volume townships like Centerville, Kasson, and Solon still recorded meaningful sales, often appealing to buyers prioritizing land, privacy, or price.
What This Means for Buyers and Sellers in 2026
The 2025 Leelanau County housing market wasn’t one-note. Buyers spread their purchases across property types, price points, and townships, proving the market is both resilient and nuanced.
If You’re a Buyer:
You don’t need waterfront to be competitive or to see long-term value.
Condos and inland homes remain strong entry points.
Location, not just frontage, is driving appreciation.
If You’re a Seller:
Pricing correctly matters more than ever.
Non-waterfront homes still command serious attention when marketed right.
Data-backed pricing beats “testing the market” every time.
Final Thoughts on Leelanau County Real Estate in 2025
Leelanau County continues to attract a wide range of buyers—from full-time residents to second-home owners—who value lifestyle, location, and long-term stability. The 2025 data shows a healthy market grounded in demand, not hype.
If you want a hyper-local breakdown of your specific township, price range, or property type, that’s where real insight happens.
Based on data provided by Northern Great Lakes REALTORS® MLS. Reliable but not guaranteed. Fractional ownership excluded.
Need Expert Real Estate Advice? Contact Jonathan Oltersdorf Today!
For personalized insights into Leelanau County real estate, reach out to Jonathan Oltersdorf at Oltersdorf Realty, LLC.
📞 Office Phone: 231-271-7777
📧 Email: jonathan@oltersdorf.com
🌐 Website: www.oltersdorf.com
Leelanau County Home Sales 2025: How 375 Buyers Purchased—Cash vs Financing
Leelanau County Single Family Home Sales 2025:
How 375 Buyers Purchased - Cash vs Financing
2025 Leelanau County Homebuyers: Cash vs. Financing Trends Explained
If you’re buying or selling real estate in Leelanau County, one question to keep an eye on in today’s market:
Are buyers paying cash, or are they financing?
The short answer for 2025: both—but financing is back in the driver’s seat.
2025 Leelanau County Home Sales Breakdown
Based on data from the Northern Great Lakes Realtors MLS, here’s how 375 total sales in Leelanau County in 2025 break down:
55% Financing
45% Cash Purchases
That’s a meaningful shift, especially when compared to 2024, when 44% of sales were cash and 2023 when 50% of sales were cash. Cash buyers didn’t disappear—but financed buyers are clearly reasserting themselves.
In other words:
💰 Cash is still powerful.
🏦 But mortgages are very much back in play.
What’s Driving Financing Back Into the Market?
1. Interest Rates Have Stabilized
The average 30-year fixed mortgage rate in 2025 is approximately 6.60%. While that’s higher than pandemic-era lows, buyers have adjusted expectations. The shock is gone. Normal decision-making has returned.
Translation: buyers aren’t waiting for “perfect” rates anymore. They’re moving forward.
2. Pent-Up Buyer Demand
Many financed buyers sat on the sidelines in 2023–2024, especially first-time and move-up buyers. By 2025, lifestyle needs (schools, downsizing, second homes) are outweighing rate anxiety.
People still need houses—even in Northern Michigan.
3. Leelanau County’s Buyer Pool Is Evolving
Leelanau County continues to attract:
Primary-residence buyers and 2nd home buyers
Professionals relocating from downstate
Buyers selling higher-priced homes elsewhere and financing strategically
Not every buyer wants to pay cash—even if they could.
What This Means for Sellers in Leelanau County
Cash offers still matter—but they’re no longer the whole story.
If you’re selling:
Expect a broader buyer pool
Well-priced homes will attract both cash and financed buyers
Clean listings, realistic pricing, and strong negotiation matter more than “cash only” thinking
Sellers who automatically dismiss financed buyers in 2025 may leave money—or better terms—on the table.
What This Means for Buyers
If you’re financing a home purchase in Leelanau County, here’s the good news:
You are not the minority
Sellers are increasingly open to financed offers
Strong pre-approvals and clean terms matter more than rate obsession
Cash buyers still have leverage—but financed buyers are competing successfully every day.
Bottom Line: A Healthier, More Balanced Market
The 2025 Leelanau County real estate market shows signs of normalization:
Financing dominates at 55% of sales
Cash remains strong at 45%
Total sales increased to 375 transactions
Buyers and sellers are adapting—not freezing
This balance is exactly what a sustainable market looks like.
If you’re thinking about buying or selling in Leelanau County or Traverse City, understanding how buyers are purchasing is just as important as knowing what homes are selling for.
Need Expert Real Estate Advice? Contact Jonathan Oltersdorf Today!
For personalized insights into Leelanau County real estate, reach out to Jonathan Oltersdorf at Oltersdorf Realty, LLC.
📞 Office Phone: 231-271-7777
📧 Email: jonathan@oltersdorf.com
🌐 Website: www.oltersdorf.com
Where did 2025 Leelanau County Homebuyers Come From?
Where did 2025 Leelanau County
Homebuyers Come From?
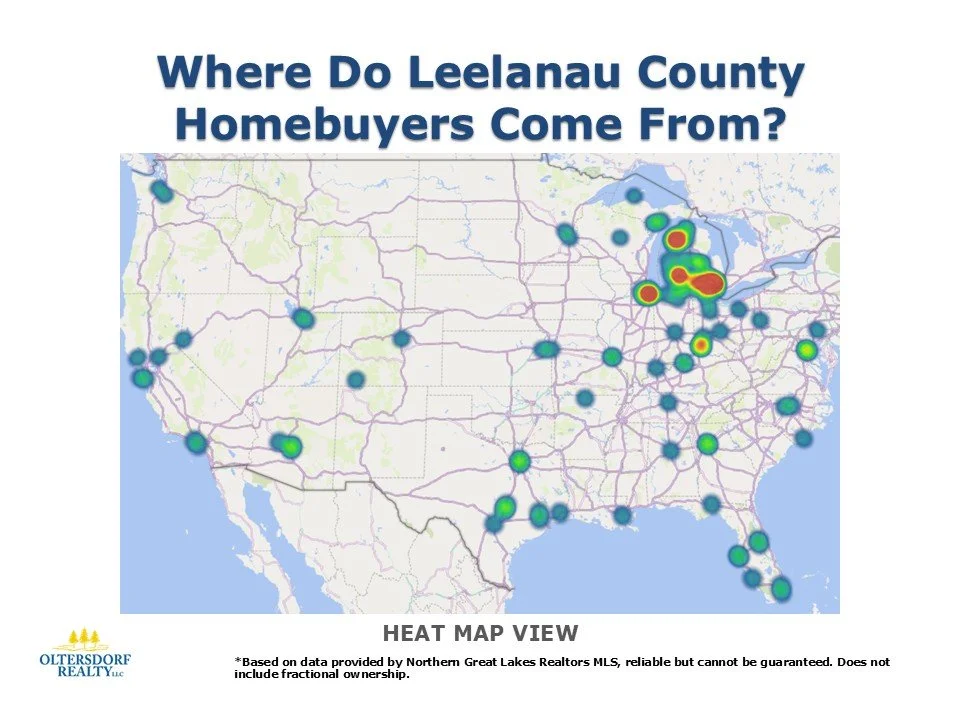
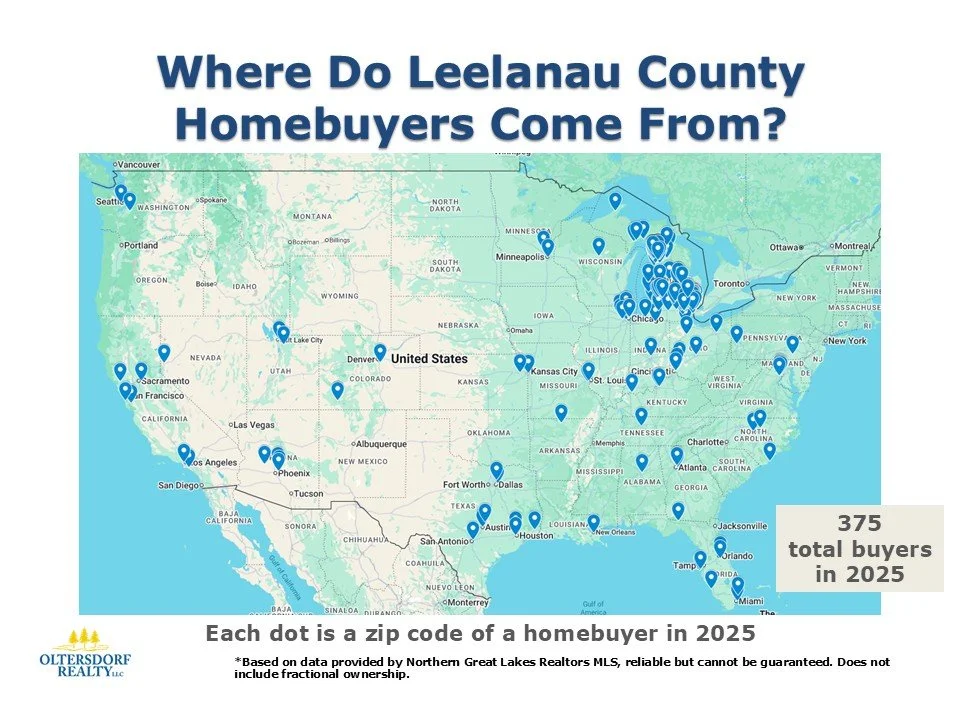
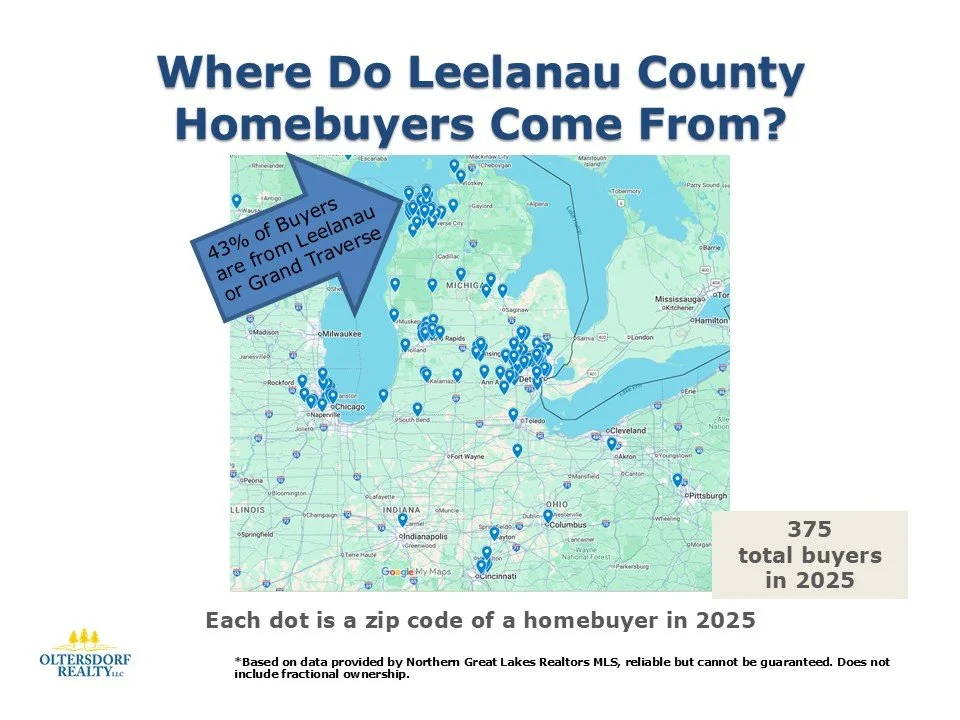
Understanding where Leelanau County homebuyers are coming from is key to understanding market demand, pricing pressure, and future trends. Based on Northern Great Lakes Realtors® MLS data, the visuals above tell a clear story: Leelanau County real estate is no longer a mostly local market — it’s a regional and national one.
Below is a breakdown of what the data shows and why it matters if you’re thinking about buying or selling property in Leelanau County.
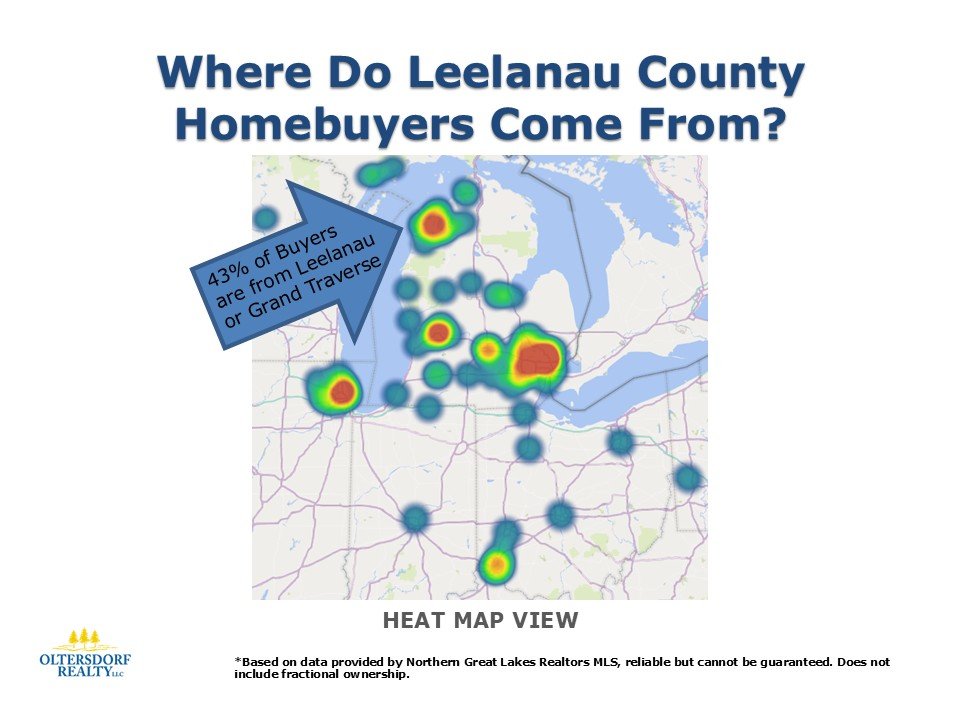
Leelanau County Buyers: A National Footprint
The heat map shows buyer zip codes spread across the entire United States, with heavy concentrations in:
Michigan (especially Southeast Michigan)
Illinois (Chicago metro area)
Ohio, Indiana, and Wisconsin
Secondary pockets along the East Coast, Texas, Florida, and the West Coast
This confirms what many sellers already feel during showings: Leelanau County attracts out-of-area buyers who are willing to travel, compete, and pay for lifestyle.
Northern Michigan is no longer a secret — it’s a destination.
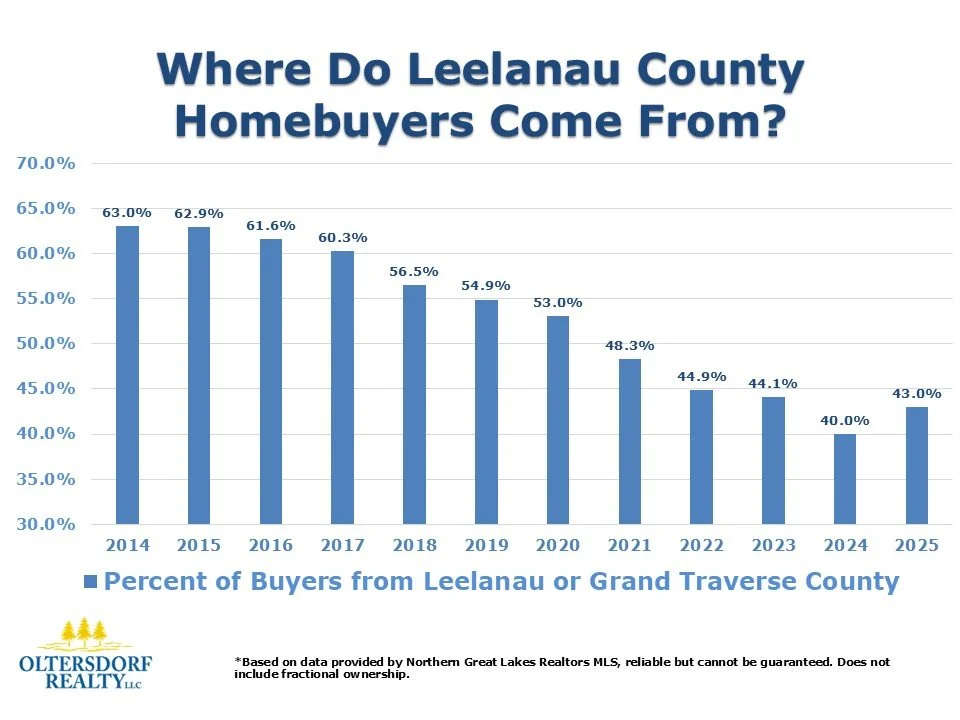
Local Buyers Are Shrinking as a Share of the Market
The bar chart highlights a long-term trend that matters a lot.
Percent of Buyers From Leelanau or Grand Traverse County:
2014: 63.0%
2016: 61.6%
2018: 56.5%
2020: 53.0%
2021: 48.3%
2023: 44.1%
2024: 40.0%
2025: 43.0%
While 2025 shows a small rebound, the big picture is clear: local buyers now represent less than half of the market.
This shift has major implications:
More cash buyers
Fewer contingency-driven offers
Stronger demand for waterfront, second homes, and short-term rental-capable properties
2025 Buyer Breakdown: The Numbers
375 total buyers in 2025
43% from Leelanau or Grand Traverse County
57% from outside the local area
Each dot on the Michigan map represents a unique buyer zip code from 2025, reinforcing how geographically diverse demand has become.
This isn’t just tourism interest — these are people putting capital into Leelanau County real estate.
Why This Matters for Sellers
If you’re selling a home or land in Leelanau County, this data should shape your strategy.
Out-of-area buyers:
Rely heavily on online listings, photos, video, and data
Are more emotional about lifestyle and views than price-per-square-foot
Often make faster decisions
That means:
Professional marketing matters
Overpricing gets exposed quickly
Unique properties perform best when positioned correctly
The market rewards sellers who understand who the buyer actually is.
What This Means for Buyers
If you’re a local buyer, the competition isn’t your neighbor — it’s often someone from:
Metro Detroit
Chicago
Cincinnati or Columbus
Out-of-state buyers seeking second homes or retirement properties
Winning in this market often requires:
Strong financing or cash
Clean offers
Decisiveness
Understanding buyer origins helps explain why well-priced homes move quickly — even in shifting market conditions.
The Big Picture: Leelanau County Is a Lifestyle Market
The takeaway is simple:
Leelanau County is no longer driven primarily by local demand. It’s driven by lifestyle migration, remote work flexibility, and long-term wealth preservation.
That’s a fundamentally different market than it was 10 years ago — and it’s why smart pricing, timing, and strategy matter more than ever.
Data based on information provided by Northern Great Lakes Realtors® MLS. Reliable but not guaranteed. Does not include fractional ownership.
Need Expert Real Estate Advice? Contact Jonathan Oltersdorf Today!
For personalized insights into Leelanau County real estate, reach out to Jonathan Oltersdorf at Oltersdorf Realty, LLC.
📞 Office Phone: 231-271-7777
📧 Email: jonathan@oltersdorf.com
🌐 Website: www.oltersdorf.com
2025 Leelanau County Real Estate Market Update: Prices Rise, Sales Volume Surges
2025 Leelanau County Real Estate Market Update:
Prices Rise, Sales Volume Surges
If you’ve been waiting for Leelanau County real estate to “cool off,” 2025 politely declined. Prices rose, sales volume surged, and more homes sold than the year before. Using figures from the Northern Great Lakes Realtors® MLS, here’s what actually happened in the Leelanau County residential real estate market in 2025 and what it means moving forward.
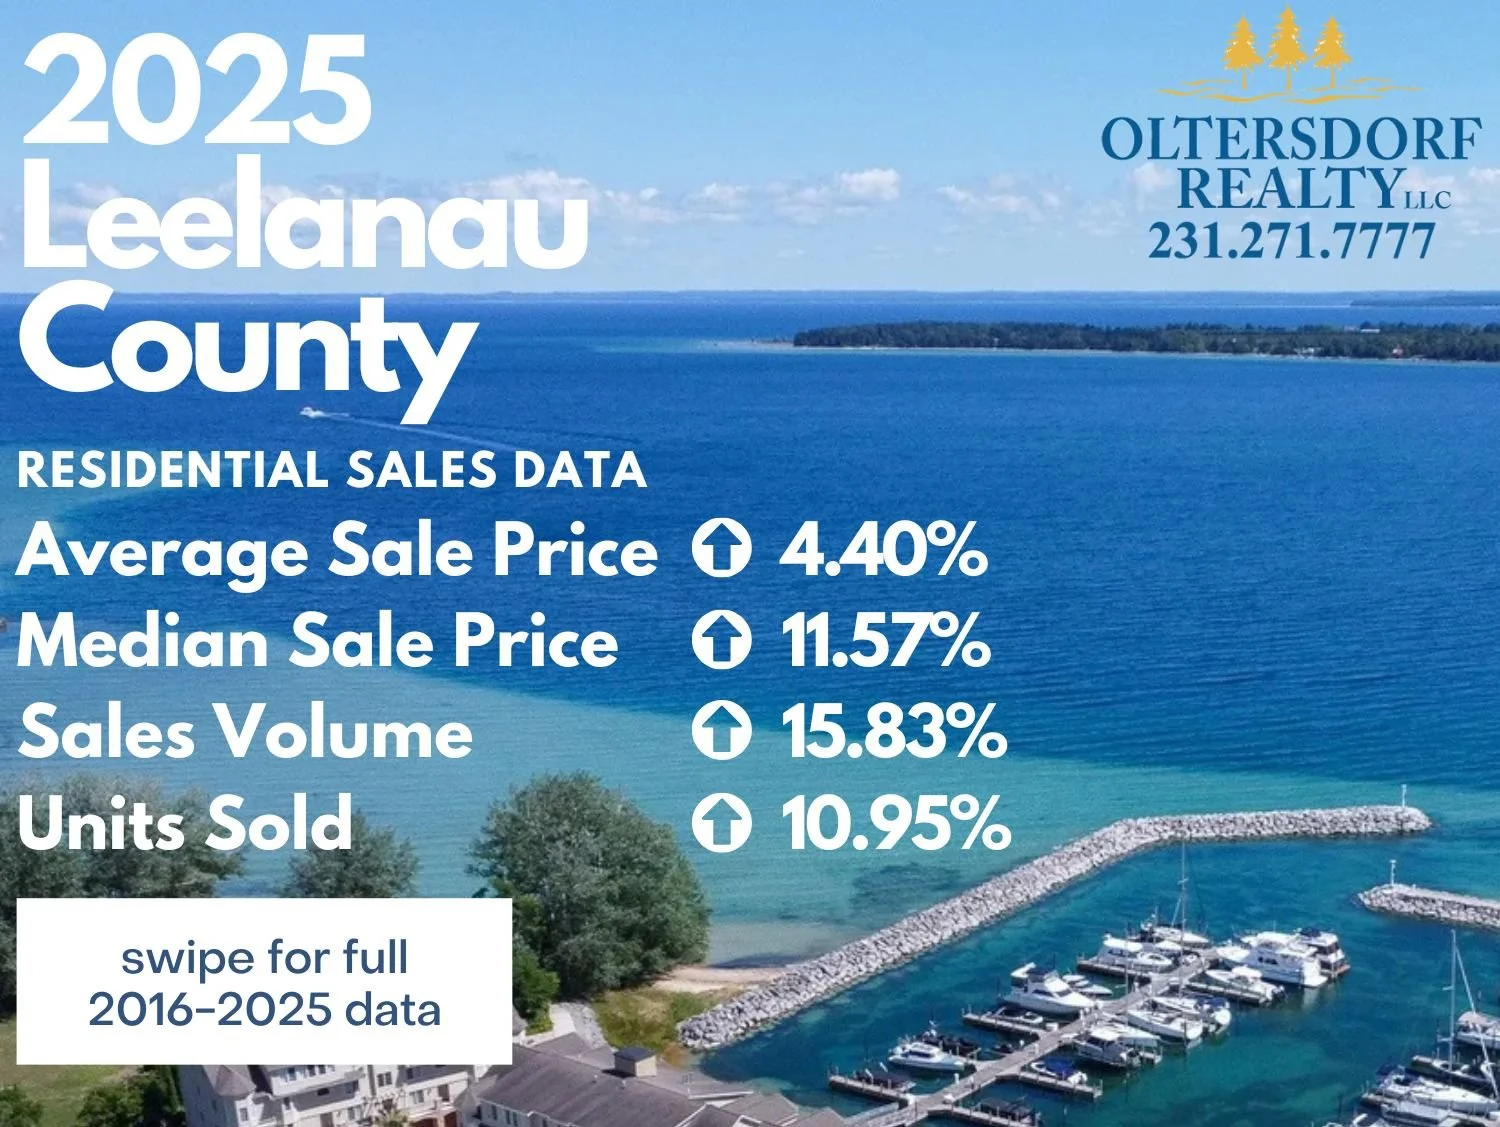


Total Residential Sales Volume Climbs Sharply
Total residential sales volume in Leelanau County reached $326,403,770 in 2025, a +15.83% increase over 2024.
That kind of growth doesn’t happen by accident, especially in a higher-rate environment. It reflects strong demand, confident buyers, and sellers successfully closing at higher price points.
Bottom line: capital is still flowing into Leelanau County real estate.
Total Homes Sold Increased by Nearly 11%
This is the stat that cuts through the noise.
2024 total homes sold: 338
2025 total homes sold: 375
Year-over-year change: +10.95%
More homes sold and higher prices means demand isn’t just holding—it’s expanding.
Why this matters:
Buyers weren’t just browsing—they were committing.
Inventory that hit the market moved.
The increase in sales volume wasn’t driven only by luxury closings.
In short: this was real market activity, not statistical inflation.
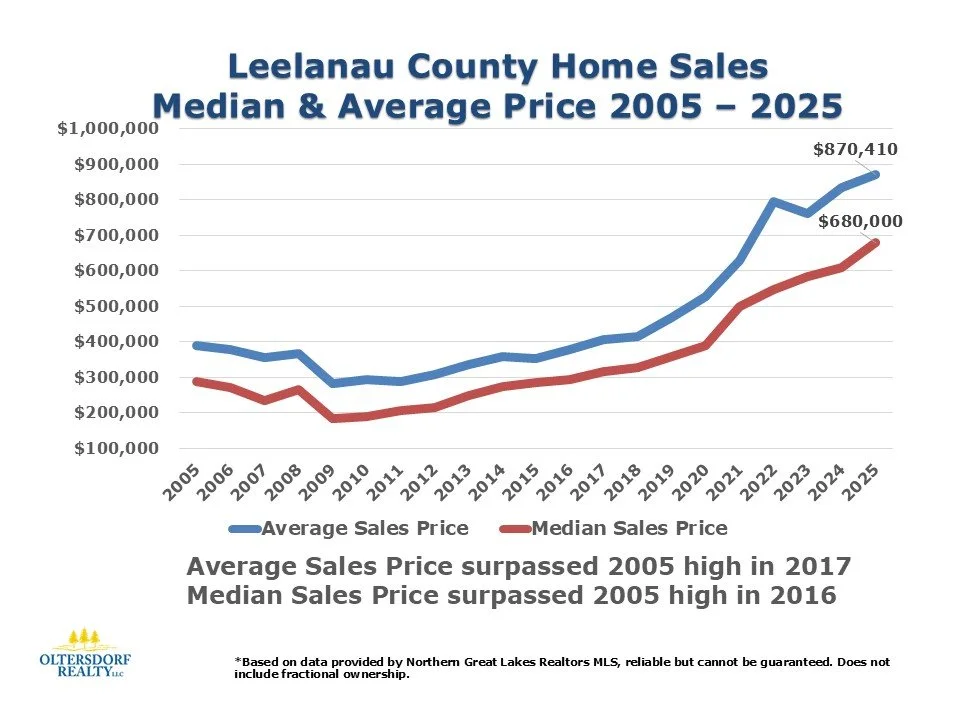
Median Home Price Reaches $680,000
The median home sales price rose to $680,000 in 2025, an 11.57% increase year-over-year.
Median price tells us what the typical Leelanau County home is doing, and this confirms price strength across the market—not just at the high end.
What it signals:
Strong competition for well-priced homes
Continued upward pressure from limited inventory
Sellers rewarded for correct pricing and preparation
Leelanau County remains a supply-constrained market, and the data shows it.
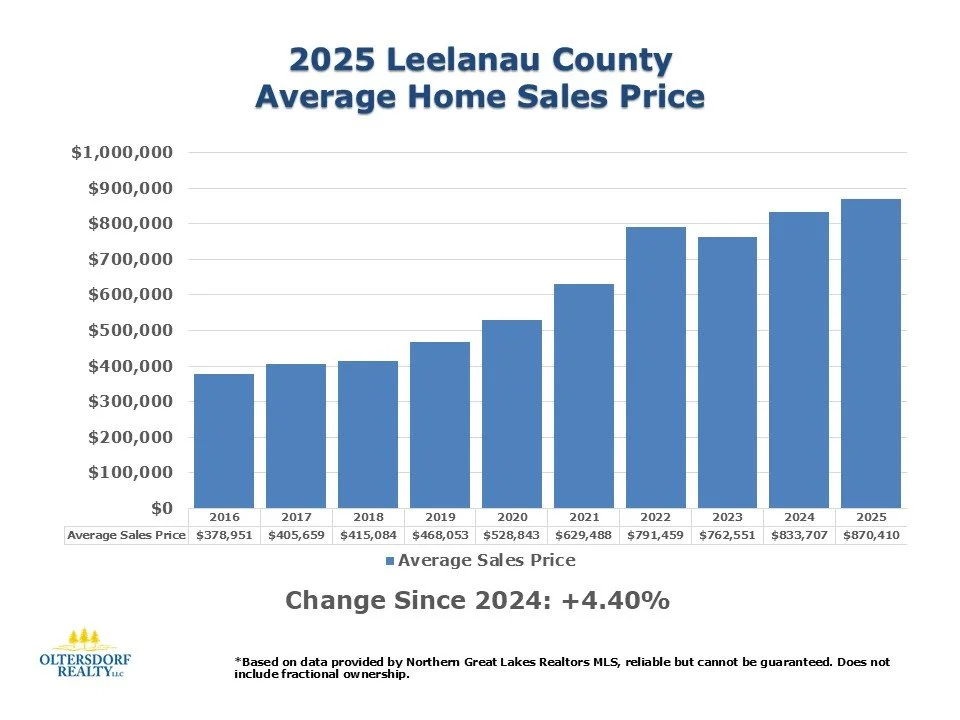
Average Home Price Shows Healthy, Slower Growth
The average home sales price increased to $870,410, up 4.40% from 2024.
This slightly slower growth compared to the median price is actually good news.
Translation:
Fewer extreme outlier sales skewing the numbers
A more balanced mix of primary, second-home, and luxury transactions
A maturing, stabilizing market—not a declining one
Stability at elevated price levels is a sign of confidence, not weakness.
What This Meant for Buyers and Sellers in 2025
Sellers:
Demand is proven, not speculative.
Homes are selling—375 of them, to be exact.
Pricing strategy matters more than ever.
Overpricing will get noticed faster than it used to. Buyers are motivated, but they’re not reckless.
Buyers:
Waiting for a major pullback in Leelanau County has historically been a losing bet.
Negotiation opportunities exist, especially on stale or improperly priced listings.
Quality homes continue to attract competition.
The smartest buyers in 2025 weren’t timing the market—they were choosing the right property.
Why Leelanau County Continues to Outperform
Leelanau County’s long-term strength comes from fundamentals that don’t change quickly:
Limited supply and strict zoning
Persistent second-home and cash-buyer demand
Lifestyle-driven purchases, not short-term speculation
Buyers thinking in decades, not rate cycles
2025 reinforced what locals already know: this market plays the long game.
Thinking About Buying or Selling in Leelanau County?
Market stats are useful—but strategy is everything. Whether you’re preparing to sell, evaluating timing, or trying to buy without overpaying, local insight matters.
If you want a straightforward, data-driven read on your situation (no sugarcoating, no national-portal nonsense), feel free to reach out.
Data based on information from the Northern Great Lakes Realtors® MLS. Reliable but not guaranteed. Does not include fractional ownership.
Need Expert Real Estate Advice? Contact Jonathan Oltersdorf Today!
For personalized insights into Leelanau County real estate, reach out to Jonathan Oltersdorf at Oltersdorf Realty, LLC.
📞 Office Phone: 231-271-7777
📧 Email: jonathan@oltersdorf.com
🌐 Website: www.oltersdorf.com
2025 Grand Traverse County Real Estate Market Report: Year-End Home Sales Data & Trends
2025 Grand Traverse County Real Estate Market Report: Year-End Home Sales Data & Trends
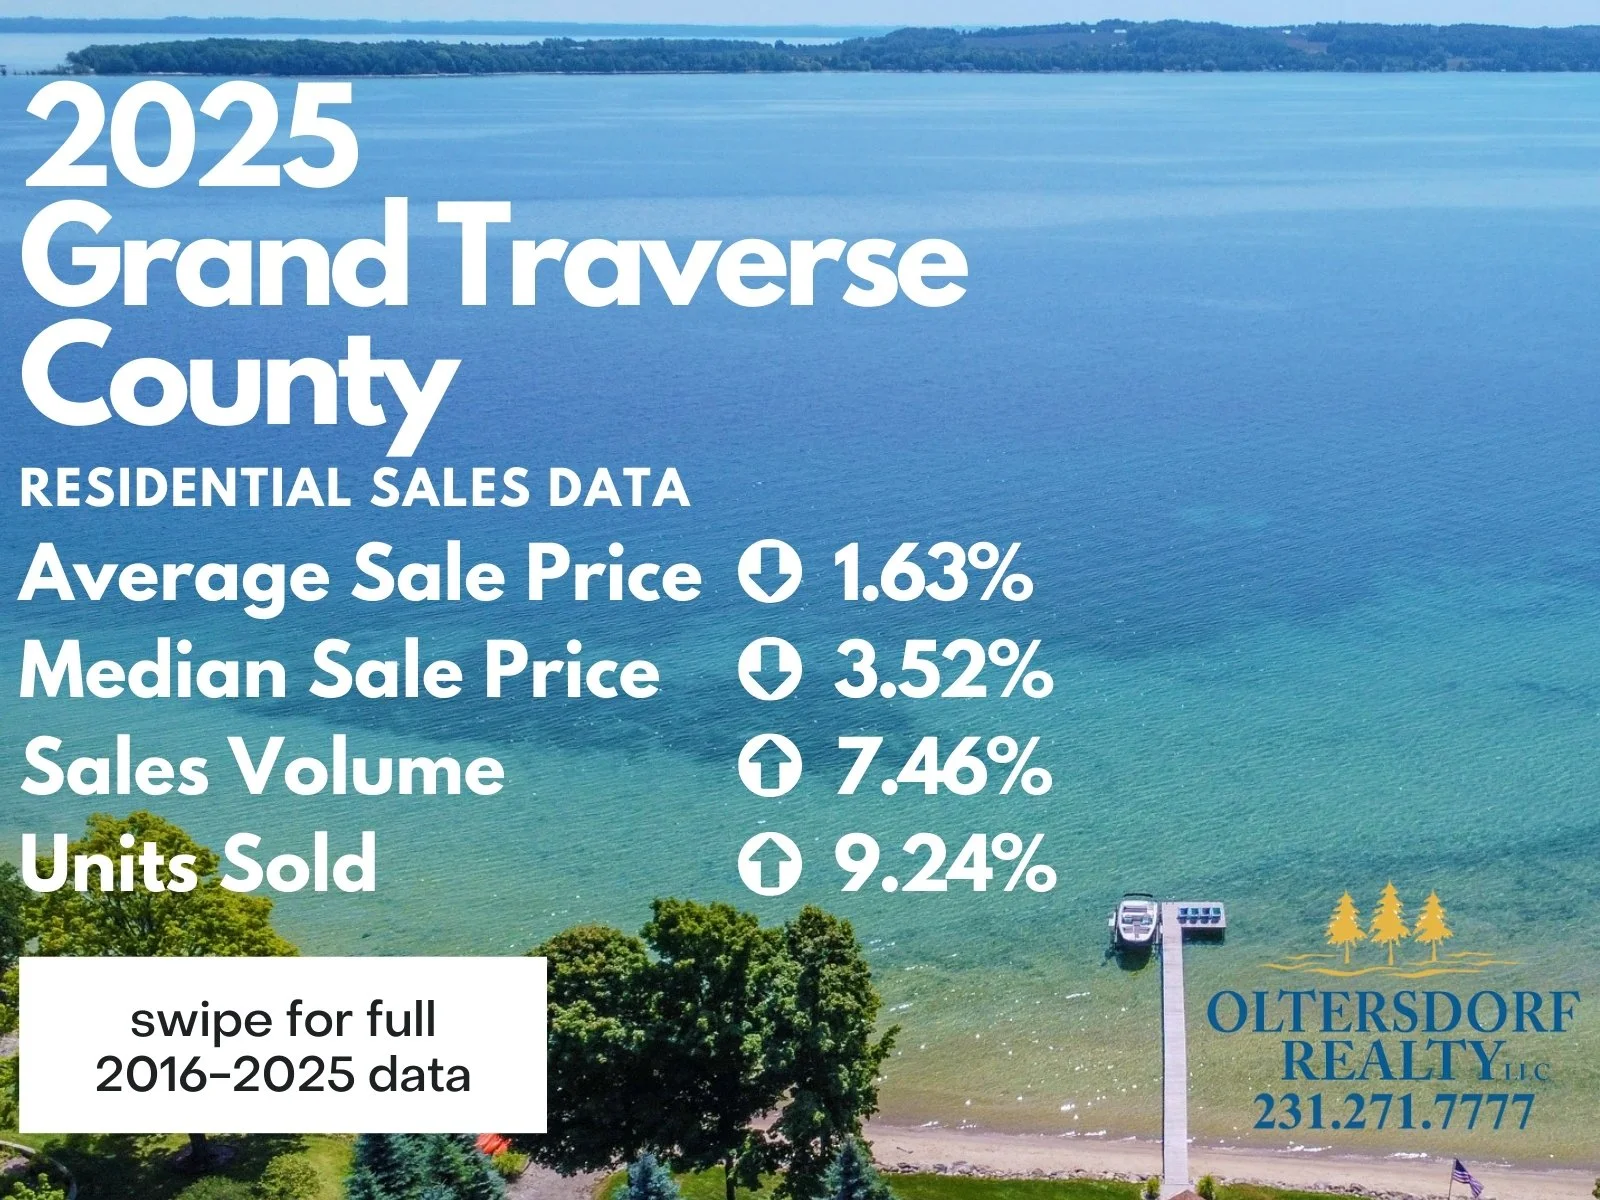
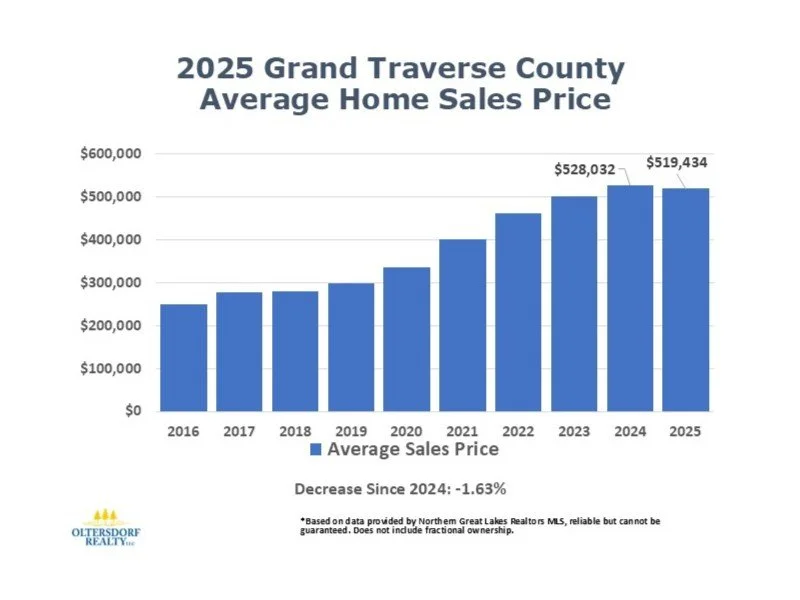


This report is based on verified MLS data from the Northern Michigan Realtors. Note that undisclosed home sales and fractional ownership transactions are excluded to maintain data accuracy.
Need Expert Real Estate Advice? Contact Jonathan Oltersdorf Today!
For personalized insights into Grand Traverse County real estate, reach out to Jonathan Oltersdorf at Oltersdorf Realty, LLC.
📞 Office Phone: 231-271-7777
📧 Email: jonathan@oltersdorf.com
🌐 Website: www.oltersdorf.com
2026 Current Lake Michigan Water Levels
2026 Current Lake Michigan Water Levels
Lake Michigan Water Levels Down -7 Inches in Past 12 Months
After several years of historically high levels, Lake Michigan water levels are finally trending downward in 2026. According to the latest data, water levels in Lake Michigan and Grand Traverse Bay have dropped 7 inches compared to this time last year and are now 17 inches lower than two years ago.
This shift is closely watched by Lake Michigan waterfront property owners, especially those in Leelanau County and Grand Traverse County, as changing lake levels directly impact shoreline conditions, erosion, docks, and long-term property planning.
Official Lake Michigan Water Level Data (January 9, 2026)
Water level data is collected and published by the U.S. Army Corps of Engineers, the official source for current and historical Great Lakes water levels.
Date of Reading: January 9, 2026
Current Lake Michigan Water Level: 577.5 feet
Lake Michigan Water Level Comparisons
Change from January 9, 2025: –7 inches
Difference from Long-Term Average: –12 inches
Difference from Highest Monthly Average (2020): –49 inches
Difference from Lowest Monthly Average (2013): +17 inches
Lake Michigan Water Level Projection
Projected Change by February 10, 2026: –1 inch
What This Means for Waterfront Property Owners
Lower water levels can reduce erosion pressure but may expose shoreline, affect dock usability, and change beach conditions—especially along Lake Michigan and Grand Traverse Bay waterfront properties. For buyers and sellers, water level trends are now becoming a bigger conversation point than they’ve been in recent years.
Short version: the lake is coming back toward normal. Slowly. No panic. No headlines. Just physics doing its thing.
For more information on current & past historic records regarding the Great Lakes Water Levels please visit: https://water.usace.army.mil/office/lre/docs/weekly/weekly.pdf
Tags Lake Michigan, Waterfront, Water Levels, Leelanau County, Grand Traverse County, West Grand Traverse Bay, Suttons Bay, Northport, Leland, Omena, Glen Arbor, Empire, Traverse City
Geography of Choice in 2020s America: Traverse City & Leelanau County
The Geography of Choice in 2020s America: What a Recent Domestic Migration Map Reveals — And Why Traverse City and Leelanau County, MI Are Winning Big
National Migration Hotspots and Cold Spots
Big winners in dark green: The Upper Rockies (+6.0% of regional population), Greater Ozarks (+3.5%), Texas Triangle (+3.5%), Southern Coastal Plain (+7.1%), and the Northwoods (+3.3% with 56,000 net new residents).
The map outlines the Northwoods (Laurentian Mixed Forest Province) stretching across northern Minnesota, Wisconsin, the Upper Peninsula of Michigan, and into the northern Lower Peninsula — a sparsely populated, forested region standing out with consistent green shading amid much of the rural Midwest's neutral or purple tones.
Major losers in purple: California (1.47 million net loss, -3.7%), the Mississippi Delta (-5.0%), and parts of the Great Plains.
The map emphasizes that migration favors scenic, nature-rich areas with lower costs and outdoor appeal — often rural or small-town spots boosted by remote work.Why the Northwoods — Including Northern Michigan — Are Attracting New Residents. The Northwoods region, including much of Northern Michigan, bucks broader Midwest trends with positive net domestic migration. This aligns with real-world data: Michigan's rural counties (especially in the northwest) saw population growth from 2020-2024 driven by domestic in-migration, offsetting natural decrease. Areas like Traverse City and surrounding counties have benefited from inflows of remote workers, retirees, and families escaping high costs, extreme heat in places like Texas/Florida, or urban pressures elsewhere.Recent reports note people moving into the Traverse City area from southern states, drawn by four-season beauty, community, and relative affordability compared to coastal hotspots.Traverse City and Leelanau County: A Prime Example of "Geography of Choice"Nestled in the heart of the Northwoods ecoregion along Lake Michigan, Traverse City, MI, and Leelanau County embody why people are choosing these areas. The region boasts stunning natural features, a thriving local economy (wine, cherries, tourism), and a peaceful lifestyle that's increasingly appealing in the 2020s.
Why Move to Traverse City or Leelanau County, MI?
Natural beauty — Pristine lakes, dunes, forests, and trails.
Quality of life — Four seasons, farm-to-table scene, wineries, and small-town vibe.
Migration momentum — Positive domestic inflows, especially post-2020, as people seek cooler climates and space.
Economic perks — Growing opportunities in tourism, remote work, and agriculture.
If you're considering a move to Northern Michigan, Traverse City and Leelanau County stand out as top destinations in America's shifting "Geography of Choice." The 2020-2024 migration map proves it: people are choosing places like ours for the lifestyle they offer.Have you noticed more out-of-state plates around town?
Lot 61 S Skye Hill Drive, Traverse City - SOLD
11604 Whittington Street, Traverse City - SOLD
JUST SOLD - Buyer Agent -> Vicky Oltersdorf. $890,000 - 11604 Whittington Street, Traverse City | Stunning 4-bedroom Craftsman-style walk-out ranch in Traverse City’s coveted Morgan Farms neighborhood, featuring high-end finishes, a walk-out lower level with wet bar, premium upgrades throughout, and a private, landscaped lot backing to serene natural area just minutes from downtown!
750 Centre Place #2, Traverse City - SOLD

JUST SOLD | Buyer Agent -> Jonathan Oltersdorf | 750 Centre Place #2, Traverse City, MI – Beautifully remodeled lakeside condo in the Willow Cove condo complex next to the Traverse City Library! This 2 bedroom, 2 bath, 986 sq ft condo has been beautifully renovated from top to bottom and offers a convenient downtown Traverse City location with Boardman Lake views, a private balcony, and car port.
7470 S Shugart Road Traverse City– SOLD
SOLD SOUTH LAKE LEELANAU RANCH HOUSE
LISTING SOLD by Oltersdorf Realty LLC on 10/2/2025
$1,399,000 - 7470 S Shugart Road, Traverse, MI – 3 Bedroom, 2.5 Bath Ranch Home on South Lake Leelanau with a Sandy Shoreline, Sunset Views, and an Extra Lot!


Step onto South Lake Leelanau’s most coveted stretch of shoreline, featuring a sandy beach and spectacular western facing sunsets over the lake! This 3 bedroom, 2.5 bath, 1,780 sq ft ranch, built in 1991, offers turn-key, one-level living with an open living room showcasing lake views and a cozy gas fireplace, plus a spacious waterside primary suite. Additional features include an attached 2+ car garage and a detached outbuilding ideal for storing all your water toys. This rare offering includes two separate parcels, including a vacant back lot with potential to build a 2nd home (buyer to verify details with zoning). Located on quiet, low-traffic Shugart Shores, just 15 minutes from Downtown Traverse City, this property sits in Bingham Township, where Short Term Rentals are allowed with a township permit. Soak up summer on the expansive waterside deck, entertain, relax, and create unforgettable lakeside memories. Don’t miss this exceptional opportunity on Lake Leelanau! Septic replacement options may include A) leasing a neighboring property for a traditional system or B) potentially an on-site ATS, subject to site work, testing, approvals, and not guaranteed (details for both on file).
7018 Cedar Run Road, Traverse City - SOLD
Vacation Home Hotspots: Michigan #4! (2025)
🏡 Did You Know?
There are over 4.8 million vacation homes in the United States—that’s roughly 3.5% of the entire housing market! Whether it’s a beachfront escape, a cozy cabin in the woods, or a lakeside retreat, Americans love their second homes.
According to recent data, here are the top four states where vacation homes are most popular:
1️⃣ Florida – 800,000 vacation homes
2️⃣ California – 360,000 vacation homes
3️⃣ New York – 309,000 vacation homes
4️⃣ Michigan – 260,000 vacation homes
Not surprisingly, warm weather and natural beauty are big draws—but don’t sleep on the Midwest. Michigan, with its stunning Great Lakes shoreline and countless inland lakes, is a hidden gem for vacation property buyers.
Why Do People Invest in Vacation Homes?
Lifestyle: A second home offers a place to relax, recharge, and escape the daily grind.
Rental Income: Many owners rent out their vacation homes when not in use, offsetting expenses or generating income.
Long-Term Investment: Real estate in desirable vacation destinations tends to appreciate over time.
Is a Vacation Home Right for You?
Whether you're dreaming of a cottage in Leelanau County, a beachfront condo, or a mountain lodge, owning a second home can be a lifestyle upgrade and a smart investment.
➡️ Thinking about buying a vacation home in Michigan? Let’s talk. I know the local market and can help you find the right fit.
-Jonathan Oltersdorf, Oltersdorf Realty LLC