
2025 Leelanau County Real Estate Market Update:
Prices Rise, Sales Volume Surges
If you’ve been waiting for Leelanau County real estate to “cool off,” 2025 politely declined. Prices rose, sales volume surged, and more homes sold than the year before. Using figures from the Northern Great Lakes Realtors® MLS, here’s what actually happened in the Leelanau County residential real estate market in 2025 and what it means moving forward.


Total Residential Sales Volume Climbs Sharply
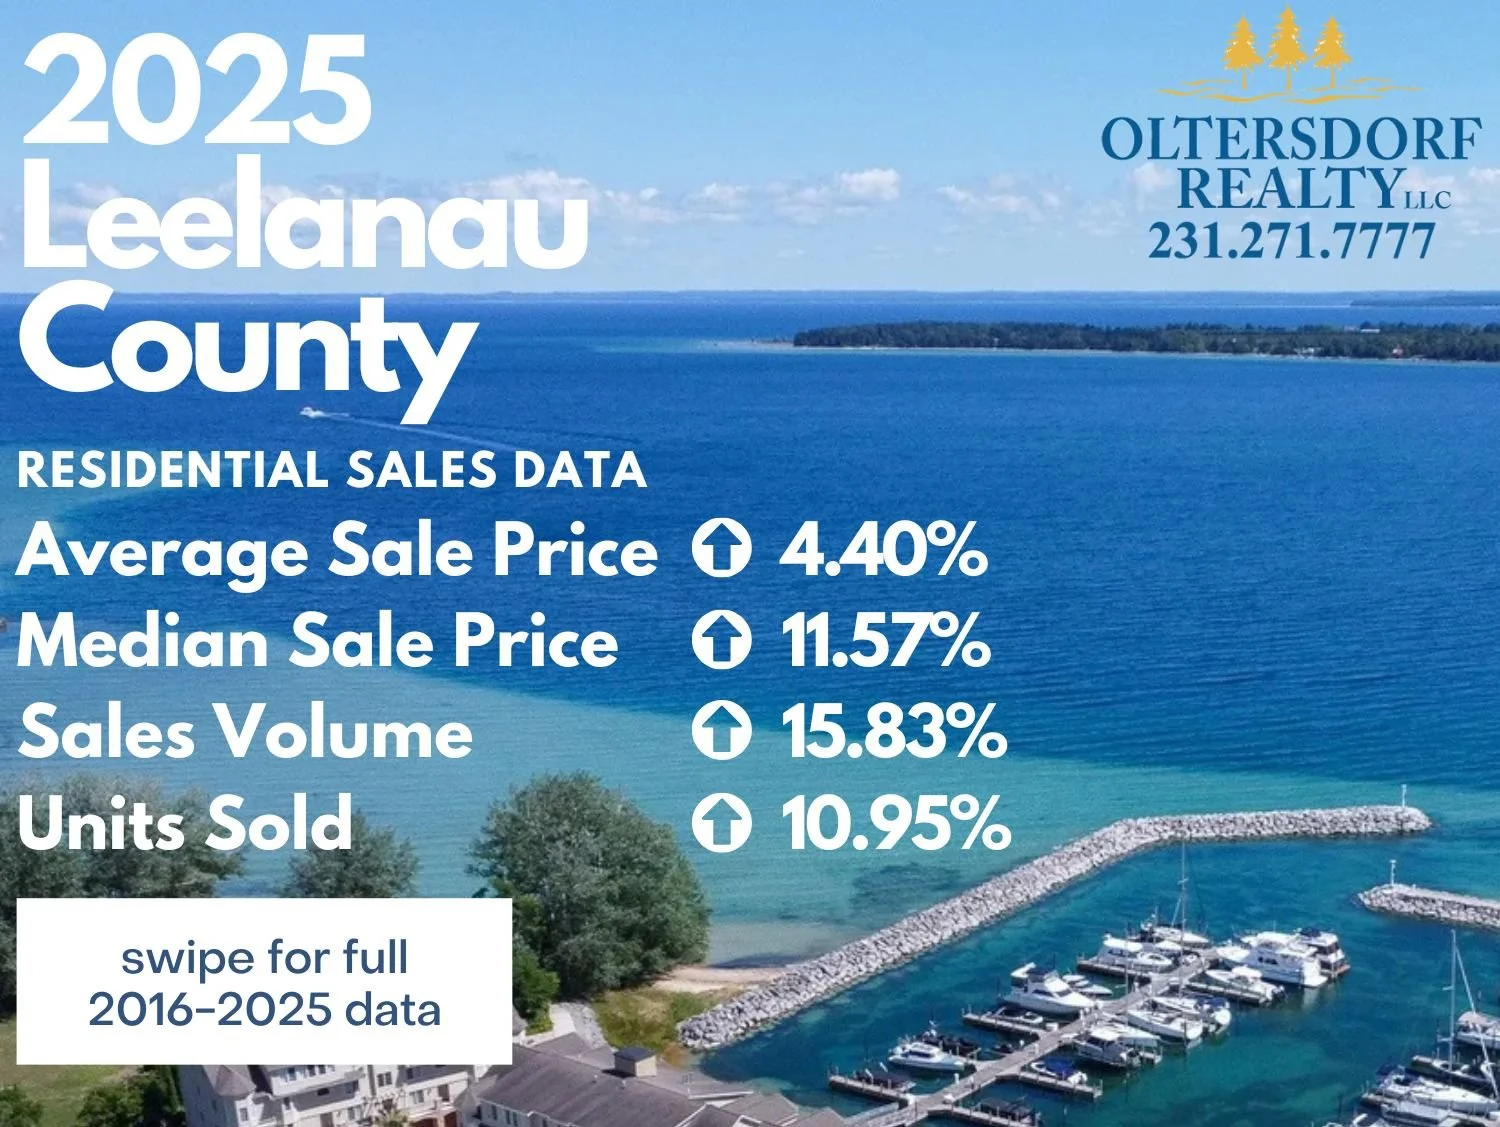
Total residential sales volume in Leelanau County reached $326,403,770 in 2025, a +15.83% increase over 2024.
That kind of growth doesn’t happen by accident, especially in a higher-rate environment. It reflects strong demand, confident buyers, and sellers successfully closing at higher price points.
Bottom line: capital is still flowing into Leelanau County real estate.
Total Homes Sold Increased by Nearly 11%
This is the stat that cuts through the noise.
2024 total homes sold: 338
2025 total homes sold: 375
Year-over-year change: +10.95%
More homes sold and higher prices means demand isn’t just holding—it’s expanding.
Why this matters:
Buyers weren’t just browsing—they were committing.
Inventory that hit the market moved.
The increase in sales volume wasn’t driven only by luxury closings.
In short: this was real market activity, not statistical inflation.
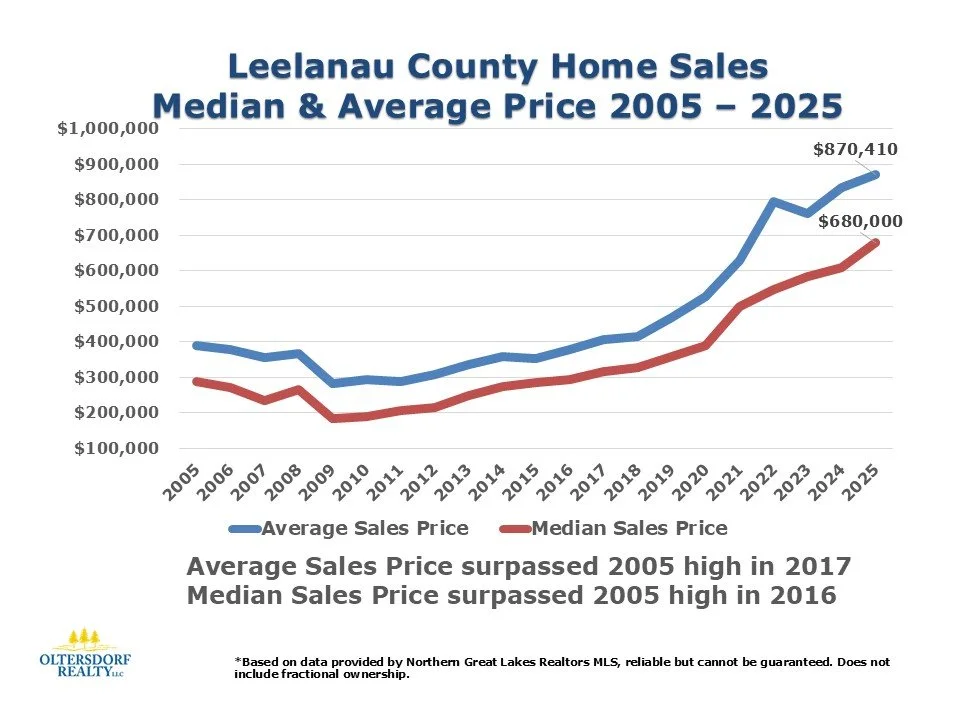
Median Home Price Reaches $680,000
The median home sales price rose to $680,000 in 2025, an 11.57% increase year-over-year.
Median price tells us what the typical Leelanau County home is doing, and this confirms price strength across the market—not just at the high end.
What it signals:
Strong competition for well-priced homes
Continued upward pressure from limited inventory
Sellers rewarded for correct pricing and preparation
Leelanau County remains a supply-constrained market, and the data shows it.
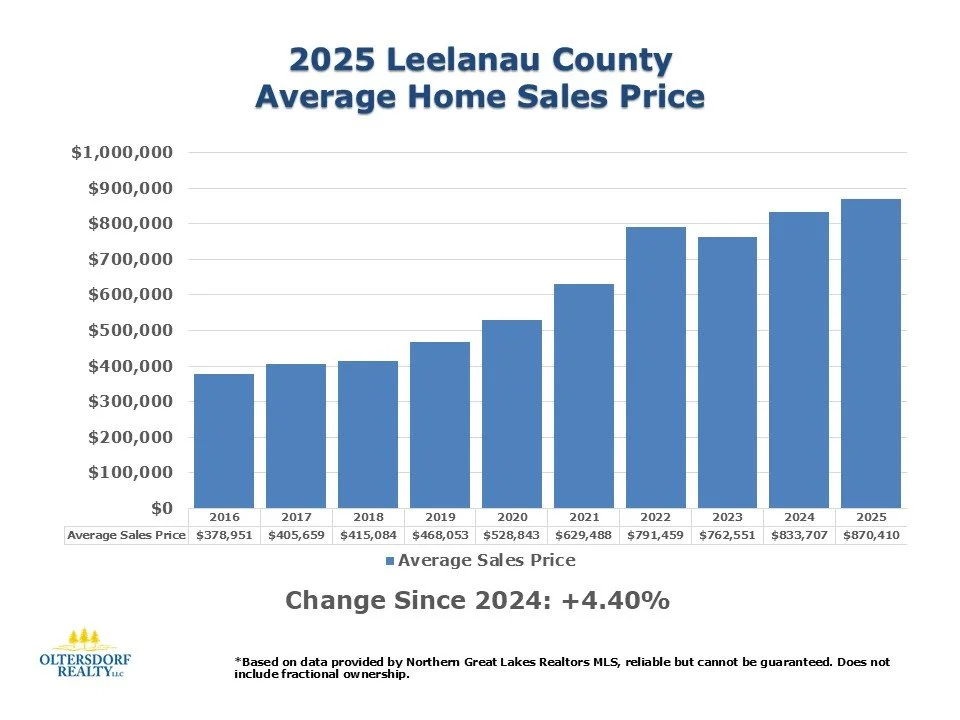
Average Home Price Shows Healthy, Slower Growth
The average home sales price increased to $870,410, up 4.40% from 2024.
This slightly slower growth compared to the median price is actually good news.
Translation:
Fewer extreme outlier sales skewing the numbers
A more balanced mix of primary, second-home, and luxury transactions
A maturing, stabilizing market—not a declining one
Stability at elevated price levels is a sign of confidence, not weakness.
What This Meant for Buyers and Sellers in 2025
Sellers:
Demand is proven, not speculative.
Homes are selling—375 of them, to be exact.
Pricing strategy matters more than ever.
Overpricing will get noticed faster than it used to. Buyers are motivated, but they’re not reckless.
Buyers:
Waiting for a major pullback in Leelanau County has historically been a losing bet.
Negotiation opportunities exist, especially on stale or improperly priced listings.
Quality homes continue to attract competition.
The smartest buyers in 2025 weren’t timing the market—they were choosing the right property.
Why Leelanau County Continues to Outperform
Leelanau County’s long-term strength comes from fundamentals that don’t change quickly:
Limited supply and strict zoning
Persistent second-home and cash-buyer demand
Lifestyle-driven purchases, not short-term speculation
Buyers thinking in decades, not rate cycles
2025 reinforced what locals already know: this market plays the long game.
Thinking About Buying or Selling in Leelanau County?
Market stats are useful—but strategy is everything. Whether you’re preparing to sell, evaluating timing, or trying to buy without overpaying, local insight matters.
If you want a straightforward, data-driven read on your situation (no sugarcoating, no national-portal nonsense), feel free to reach out.
Data based on information from the Northern Great Lakes Realtors® MLS. Reliable but not guaranteed. Does not include fractional ownership.
Need Expert Real Estate Advice? Contact Jonathan Oltersdorf Today!
For personalized insights into Leelanau County real estate, reach out to Jonathan Oltersdorf at Oltersdorf Realty, LLC.
📞 Office Phone: 231-271-7777
📧 Email: jonathan@oltersdorf.com
🌐 Website: www.oltersdorf.com


