How to Understand Your Leelanau County and Grand Traverse County (Traverse City) Property Tax Assessment

Every year, typically by the last week of February you will be mailed your new notice of assessment informing you of your updated State Equalized Value and Taxable Value on your property. This notice is sent to all property owners in Michigan.


Understanding Terminology


State Equalized Value (SEV): The dollar value of an asset assigned by a public tax assessor for the purposes of taxation.


SEV x 2 = The Township Assessors total estimated current market value for your home and/or property.


Taxable Value: The current dollar value assessment established for property tax purposes.


Taxable Value x 2 = The total estimated dollar value for your home and/or property that you will be paying tax on.


Taxable Value x Your Township Millage Rate + Township Administration Fee (1% fee charged in some townships)= Your Tax Bill


Why are these numbers different?

-In 1994 Michigan passed Proposal A creating a new standard in which your property tax would be calculated. The current tax law allows the taxable value of a property to increase by the lesser of 5% or the rate of inflation. In recent years inflation has been under 5% so your tax bill would increase yearly by that rate. Property values, until recently, had continued to soar and appreciate above the rate of inflation. This created a gap between your State Equalized Value (which has no limit to its increase ceiling per year) and your Taxable Value (which had a max of 5% per year value increase).


Why is my tax bill still increasing during this downturn?

-Today, most home and property values in Leelanau and Grand Traverse Counties have flattened or declined so you should not see your SEV continue to soar at high percentages from year to year like in the past. There still might be a gap between your SEV and Taxable Value (As the local real estate market declines these numbers will become closer in value). This is why you will see your tax bill continue to increase every year (by the rate of inflation or 5%, whichever is less) until your Taxable Value = Your State Equalized Value. If your current taxable value is less than your current SEV Proposal A has saved you money! However the taxable value may need to be adjusted to meet current market values. The current law allows upon sale of a property the taxable value of a property to uncap to the current level of the properties SEV. This is why the year after the purchase of a property a new owner must be sure to pay particular attention to this notice!!


How do I reduce my property taxes?

1) Upon receipt of your notice of property assessment from your local Township Assessor in February of each year you should review your properties proposed SEV and Taxable Values. (This notice will be labeled Notice of Assessment- THIS IS NOT A TAX BILL)


2) By multiplying this proposed current year Taxable Value x 2 you will be able to determine the dollar value of the property the local assessor will be basing your current year’s taxes. If your house is worth more than this value then you have no case to reduce your taxes for this year. Conversely, if you feel the proposed Taxable Value of your property X 2 is more than you feel your house is worth you could have a case.


3) By multiplying the proposed current year SEV by 2 you will be able to determine the current dollar (market) value the local assessor has placed on your property.


4) Be sure to check your Homeowners Principal Residence % exemption to be sure it is correct. 100% means you are receiving this exception as your primary home for this calendar year.


5) Every township and/or city has specific times published on this notice and in the local paper (Leelanau Enterprise and Record-Eagle) during early March which is the designated time for you to meet with the township assessor and a local board of review for reviewing your case. At this time you must come prepared with sales data and/or official appraisals of recent sold comparables to your property. These published times in early March are your only opportunity all year to plead your case to reduce your entire years tax bill. If you miss this “Board of Review” you must wait until March of the following year. There are a few exceptions to this rule. The Township Assessor could agree to correct errors on the properties tax card during the year within a specific time frame required by the state.


Official written appraisals by a state licensed appraiser are your best option for obtaining statistical data confirming your properties over assessment. This written appraisal will have a cost associated to its completion with no guarantee that the local board of review will reduce your tax assessment and your bill! If your property is greatly over assessed this cost will be minimal in relation to the savings you may receive if you are successful in obtaining a reduction in your properties tax assessment.


6) Determining your proposed estimated yearly Tax Bill from this notice: By multiplying this Taxable Value times your individual townships mileage (with correct school district) and taking into consideration this properties homestead exemption status you will be able to determine the estimate of your updated tax bill. This amount may vary slightly by townships across Michigan because some townships charge a 1% administration fee for each tax bill.


If there are further questions regarding this issue we suggest you contact your local Township Assessor.


As experienced Realtor professionals at Oltersdorf Realty we do our best to assist our former clients in making sure they are being properly assessed well after we assisted them in purchasing their property or home. This notice is intended to alert all property owners that these notices are very important and must not be ignored despite the statement at the top of the document saying THIS IS NOT A TAX BILL!!!!


Written by:


Vicky Oltersdorf & Jonathan Oltersdorf

Oltersdorf Realty, LLC

231-271-7777

/

RealEstate@Oltersdorf.com


LEELANAU COUNTY MILLAGE RATES


GRAND TRAVERSE COUNTY MILLAGE RATES


(Click HERE to Download)


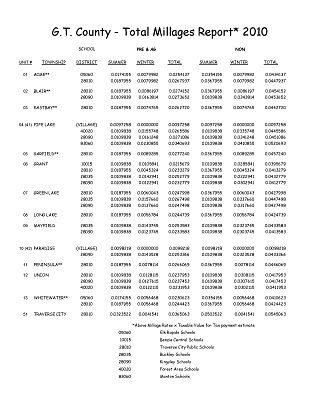
©This article is copyright protected 2010, protected by Oltersdorf Realty, LLC. ALL RIGHTS RESERVED. Any use of materials on this Web site, including reproduction, modification, distribution or republication, without the prior written consent of Oltersdorf Realty, LLC, is strictly prohibited.


Grand Traverse County - Traverse City - Millage - Property Taxes

Grand Traverse County – Traverse City - Millage – Property Taxes


THIS POST HAS BEEN UPDATED IN A NEW POST FOR 2011, VIEW IT HERE!


Below is the apportionment chart provided by the Grand Traverse County – Traverse City Equalization Department showing anticipated 2010 millage rates. This is the chart that is used to figure your estimated 2010 tax bill. Within the next couple of weeks all Grand Traverse County – Traverse City property owners will be mailed their new notice of assessment informing them of their updated 2010 State Equalized Value and Taxable Value on their property. Have you ever wondered what your property taxes would be if you lived in another township, or if you switched your homestead status to your non-primary home? The chart below is extremely helpful in comparing property taxes in all Grand Traverse County Townships whether you are in the City of Traverse City or Long Lake Township, etc. You can download the PDF by clicking HERE or on the image below. To figure your estimated tax bill, take your taxable value from your notice of assessment (or approximate house value divided by 2) and multiply it by your township millage rate on the chart (make sure you have the correct school district and homestead status).


For Example – Downtown Traverse City primary home with a Taxable Value of $100,000 (house value of $200,000)


100,000 * (0.0378046) = A yearly tax bill of $3,780


Please contact us if you have any additional questions!

/


Leelanau County Millage - Property Taxes 2010

Leelanau County Millage – Property Taxes

THE 2011 MILLAGE RATES HAVE BEEN UPDATED IN A NEW POST FOUND HERE:

/2010/11/leelanau-county-millage-property-taxes.html


Below is the apportionment chart provided by the Leelanau County Equalization Department showing anticipated 2010 millage rates (this chart was amended November, 2009). This is the chart that is used to figure your estimated 2010 tax bill. Within the next couple of weeks all Leelanau County property owners will be mailed their new notice of assessment informing them of their updated 2010 State Equalized Value and Taxable Value on their property. Have you ever wondered what your property taxes would be if you lived in another township, or if you switched your homestead status to your non-primary home? The chart below is extremely helpful in comparing property taxes in all Leelanau County Townships whether you are in Suttons Bay Township or Leelanau Township, etc. You can download the PDF by clicking HERE or on the image below. To figure your estimated tax bill, take your taxable value from your notice of assessment (or approximate house value divided by 2) and multiply it by your township millage rate on the chart divided by 1000 (make sure you have the correct school district and homestead status).


For Example – Suttons Bay Township primary home with a Taxable Value of $150,000


150,000 * (21.8139/1000) = A yearly tax bill of $3,272


Please contact us if you have any questions!

/


Traverse City - Leelanau January 2010 Home Sales Data

2010 home sales have kicked off similar to the way the fall of 2009 ended (very promising) as the Traverse City Area Association of Realtors have released the sales figures for January 2010 in the local 5 county area (Leelanau, Grand Traverse, Benzie, Antrim, Kalkaska). Local real estate agents have reporting to us an increased in activity across the board and we have remained very busy at Oltersdorf Realty as well! I have put together several charts to track 2010 January home sales and compared them to previous years. Sales volume for January 2010 is reported as a 26% increase over 2009! Housing units sold is slightly down but the average sold price and median sale price is up substantially! Hopefully this trend will continue in Leelanau County and the entire Traverse City area through the spring.

-Jonathan Oltersdorf
http://www.oltersdorf.com


This report is based upon sales information obtained from the Traverse Area Multiple Listing Service from 2007-2010 for the 5 County Area (Grand Traverse, Antrim, Leelanau, Kalkaska, Benzie). Undisclosed sales are not included in the data.

January 27, 2010 Real Estate Snapshot

Below is a market snapshot of national real estate trends as of January 27, 2010. Please keep in mind that this data is based on national averages and our local real estate market in Leelanau County and Grand Traverse County can be quite different.

Daily Forecast Update
•• NAR's monthly official forecast as of January 5th
•• GDP 2009 Q4: +4.2%
•• GDP 2010 Q1: +2.7%
•• GDP 2010 Q2: +2.4%
•• Unemployment rate by the mid-2010: 10.1%
•• Average 30-year fixed mortgage rate by mid-2010 2009: 5.6%

What does today's data mean for REALTORS and consumers?
•• New single-family home sales continued to struggle in December, falling by 7.6% from the previous month on a seasonally adjusted basis. New home sales are down 23% in 2009 from 2008. The median price of new single-family homes, however, rose in December to $221,300.
•• Although new sales and new home starts are well below their historical averages, the recent decline in new construction has helped keep additional inventory off the market to the benefit of the existing home sale market. From 2000 to 2006, there were approximately 5 existing single-family homes sold for every one new home sale. In 2009, there were 12 existing single-family homes sold for every one new home sale.
•• Mortgage loan applications declined this week for both refinancing and purchases despite interest rates still near 5%. The cessation in purchase applications is in part due to the initial expiration of the home buyer tax credit in November.
•• Although the MBA weekly survey is somewhat volatile from week to week, and it omits all cash purchases, the recent decline in purchase applications is likely an indication of lower home sales in the first quarter of 2010 following the huge surge in home sales in the fourth quarter of 2009. NAR is predicting a 5.5M annualized sales pace in the first quarter of 2010, compared with 6M in the fourth quarter of last year. The projected first quarter pace is still above the total 2009 existing home sales of 5.1M.

New Home Sales
•• New single-family home sales fell in December to an annualized rate of 342,000.
•• Sales were revised upward for November by 15,000 to 370,000.
•• December sales were 28,000 below the consensus for December of 370,000, or 7.6%.
•• The median sales price of new single-family homes rose in December by 5.2% from November to $221,300.
•• Month’s supply of new single-family homes rose to 8.2 months in December from 7.6 months in November.

Mortgage Applications
•• According to MBA’s weekly survey, refinancing loan applications decreased in the week of January 27th by 15.1% from the previous week.
•• Similarly, the index of purchase loan applications fell by 3.3% from the previous week.
•• Purchase applications reached their recent peak in early October, approximately two months before the initial expiration of the first-time HBTC.
•• The average contract interest rate on 30-year mortgages increased minimally to 5.02% in the current week.

Copyright National Association of REALTORS®, Reprinted with permission.

/

Traverse City Region 2009 Year End Home Sales Statistics

The 2009 Traverse City area home sales statistics have now been reported. The number of closed sales in 2009 was 10.71% higher than 2008 while overall dollar volume was down 3.80%. Average sales price and median sales price were down drastically over 2008. For a full breakdown of 2009 year end sold market statistics please contact Oltersdorf Realty, LLC at /.

-Jonathan Oltersdorf

This report is based upon sales information obtained from the Traverse Area Multiple Listing Service from 2003-2009 for the 5 County Area (Grand Traverse, Antrim, Leelanau, Kalkaska, Benzie). Undisclosed sales are not included in the data.

Lake Michigan Water Levels To Rise


A recent announcement by the Army Corps of Engineers has many local Traverse City / Leelanau waterfront property owners excited as water levels are expected to rise ~6 inches over 2009 to approach long term averages. Statistical data on current and historical Lake Michigan water levels can be found on the Army Corps website HERE. The Traverse City Record Eagle has a nice article on this topic posted on their website today at : http://www.record-eagle.com/local/local_story_007074013.html

-Jonathan Oltersdorf
/

November 2009 Home Sales Data

You can find below the home sales data for November, 2009 within the Traverse City 5-county area (Grand Traverse, Leelanau, Antrim, Kalkaska, Benzie).

As you can see the data for last month is very promising for real estate sales in our area. Total sales are up 52% and sales volume is up 50% over November 2008. Although the data is skewed slightly due to the financial crisis last fall, November 2009 was still a great month for real estate sales in the Traverse City/ Leelanau area. The numbers are even up from October, 2009 which is unusual as activity during the winter months typically starts to slow down in November. Check back next month for year end statistics.

This report is based upon sales information obtained from the Traverse Area Multiple Listing Service from October 2009, November 2009, and November 2008. Undisclosed sales are not included in the data.

-Jonathan Oltersdorf

http://www.oltersdorf.com

October 2009 Home Sales Data

You can find below the home sales data for October, 2009 within the Traverse City 5-county area (Grand Traverse, Leelanau, Antrim, Kalkaska, Benzie).


5-County AreaSold HomesDollar VolumeAverage PriceMedian Price

OCT . 2009207$35,128,554 $169,703$135,000
SEPT. 2009197$38,862,024 $197,269$136,000

OCT . 2008

191$39,313,039 $205,827

$149,900


Similar to previous months more homes are selling than in the month before. Dollar volume, average price and median price are down. The third quarter of 2009 was very strong for many of the local real estate companies and this has continued into October as the bottom end of the market and the affordable family homes have remained the strongest segment of the market. This will only continue through the winter as the first time home buyer credit has been extended.


This report is based upon sales information obtained from the Traverse Area Multiple Listing Service from October 2008, September 2009, and October 2009. Undisclosed sales are not included in the data.


-Jonathan Oltersdorf
http://www.oltersdorf.com


September 2009 Traverse City Home Sales

I am very delayed in posting but below you will find the sales data for September, 2009 within the Traverse City 5-county area (Grand Traverse, Leelanau, Antrim, Kalkaska, Benzie).


5-County AreaSold HomesDollar VolumeAverage PriceMedian Price

SEPT. 2009197$38,862,024 $197,269$136,000
AUGUST 2009188$34,928,520 $185,790$179,200

SEPT. 2008

150$31,878,540 $212,524

$152,375


Similar to previous months more homes are selling than in the month before (August) and when compared to September 2008 there were 11% more sales. Dollar volume is way up for September, 2009 while median price still lags behind due to a high volume of first time home buyers becoming home owners.


This report is based upon sales information obtained from the Traverse Area Multiple Listing Service from September 2008, August 2009, and September 2009. Undisclosed sales are not included in the data.


-Jonathan Oltersdorf


First Time Home Buyer Credit Extended / New Incentives

First-time home buyers and qualified repeat home buyers in the Traverse City area can breathe a sign of relief as The Worker, Homeownership, and Business Assistance Act of 2009 was passed last week! It has extended or created incentives to home buyers through April 30, 2010! Below is information taken from the official government website which can be found at http://www.federalhousingtaxcredit.com/

$8,000 First-time Home Buyer Tax Credit at a Glance

  • The $8,000 tax credit is for first-time home buyers only. For the tax credit program, the IRS defines a first-time home buyer as someone who has not owned a principal residence during the three-year period prior to the purchase.
  • The tax credit does not have to be repaid.
  • The tax credit is equal to 10 percent of the home’s purchase price up to a maximum of $8,000.
  • The tax credit applies only to homes priced at $800,000 or less.
  • The tax credit now applies to sales occurring on or after January 1, 2009 and on or before April 30, 2010. However, in cases where a binding sales contract is signed by April 30, 2010, a home purchase completed by June 30, 2010 will qualify.
  • For homes purchased on or after January 1, 2009 and on or before November 6, 2009, the income limits are $75,000 for single taxpayers and $150,000 for married couples filing jointly.
  • For homes purchased after November 6, 2009 and on or before April 30, 2010, single taxpayers with incomes up to $125,000 and married couples with incomes up to $225,000 qualify for the full tax credit.

The $6,500 Move-Up / Repeat Home Buyer Tax Credit at a Glance

  • To be eligible to claim the tax credit, buyers must have owned and lived in their previous home for five consecutive years out of the last eight years.
  • The tax credit does not have to be repaid.
  • The tax credit is equal to 10 percent of the home’s purchase price up to a maximum of $6,500.
  • The tax credit applies only to homes priced at $800,000 or less.
  • The credit is available for homes purchased after November 6, 2009 and on or before April 30, 2010. However, in cases where a binding sales contract is signed by April 30, 2010, the home purchase qualifies provided it is completed by June 30, 2010.
  • Single taxpayers with incomes up to $125,000 and married couples with incomes up to $225,000 qualify for the full tax credit.

    Source: http://www.federalhousingtaxcredit.com/home.html

http://www.oltersdorf.com

August 2009 Home Sales, Traverse City

Home sales statistics have been finalized for closed sales during August of 2009. I have compared them to July of 2009 and August of 2008 for the Traverse City 5-county area (Grand Traverse, Leelanau, Antrim, Kalkaska, Benzie).


5-County AreaSold HomesDollar VolumeAverage PriceMedian Price

AUGUST 2009188$34,928,520 $185,790$149,200
JULY 2009198$38,330,997 $193,591$140,500

AUGUST 2008

186$39,850,500 $214,250

$138,875

Bank Owned Foreclosures
August 2009- 25.50% of sales

July 2009 - 25.75% of sales

August 2008- 23.10% of sales


According to recent sales statistics the local market seems to be holding its own in this economy. Closed sales are stable, median home prices are actually increasing, while average home prices have declined due to the lack of sales on the top end of the market. It is difficult to tell if the market has hit bottom until about 6 months after it has happened but the numbers look better than expected, although there are still obvious gaps in activity in certain portions of the market. We have had a very busy August and September so far.


This report is based upon sales information obtained from the Traverse Area Multiple Listing Service from August 2008, July 2009, and August 2009. Undisclosed sales are not included in the data.


-Jonathan Oltersdorf
http://www.oltersdorf.com


National Home Sales July 2009

As a follow-up to my previous posted entry regarding Traverse City area home sales statistics for July 2009, the National Association of Realtors® have announced the national statistics for July and the numbers look great! For the first time in five years, existing-home sales have increased for four months in a row, according to the National Association of Realtors®.

Lawrence Yun, NAR chief economist, said he is encouraged. “The housing market has decisively turned for the better. A combination of first-time buyers taking advantage of the housing stimulus tax credit and greatly improved affordability conditions are contributing to higher sales,” he said.

The monthly sales gain was the largest on record for the total existing-home sales series dating back to 1999.

“Because price-to-income ratios have fallen below historical trends, there are more all-cash offers. In some recovering markets like San Diego, Las Vegas, Phoenix, and Orlando, the demand for foreclosed and lower priced homes has spiked, and a lack of inventory is becoming a common complaint,” Yun said.

You can read the full article on the NAR site by clicking HERE.

Traverse City, July 2009 Home Sales

Home sales statistics have been finalized for closed sales during July of 2009. I have compared them to June of 2009 and July of 2008 for the Traverse City 5-county area (Grand Traverse, Leelanau, Antrim, Kalkaska, Benzie).


5-County AreaSold HomesDollar VolumeAverage PriceMedian Price

JULY 2009198$38,330,997 $193,591$140,500
JUNE 2009195$38,997,270 $199,986$143,000

JULY 2008

180$40,424,955 $224,583

$154,900


This report is based upon sales information obtained from the Traverse Area Multiple Listing Service from July 2008, June 2009, and July 2009. Undisclosed sales are not included in the data.


When comparing July 2009 to July 2008, home sales have actually increased over the past year from 180 closed transactions in 2008 to 198 in 2009. As expected Dollar Volume, Average Price, and Median Price have dipped as the bottom of the market is seeing the most activity.
EDIT: There were 51 bank owned sales in July which resulted 25.75% of total sales. Looking back at June-2009, bank owned properties were 29% of total home sales.


-Jonathan Oltersdorf


http://www.oltersdorf.com


Traverse City, Buy Now-Retire Later

Traverse City is once again getting national attention for young retirees as it was recently named one of the best 5 places to retire in the country, this time by USA Weekend. The rankings are compiled based on recreation, weather, health resources, crime and cost of living. With prices so low, (median home price around $130,000) many people in their late 50’s are hoping to buy now before the economy rebounds and then retire to the area permanently within a couple of years. The full article can be found HERE.

Source: USA Weekend, Reyhaneh Fathieh (07/26/2009)

CenterPointe Building & Marina

Oltersdorf Realty LLC is proud to announce the listing of the truly unique CenterPointe commercial building and marina in Elmwood Township at the base of beautiful Leelanau County!

$7,500,000

Exciting opportunity to own this one of a kind, recently refurbished 64,000 sq.ft commercial office complex offering diversified income with unlimited potential, a long list of amenities and expansion options, panoramic Bay and Traverse City views, 543 ft of direct West Grand Traverse Bay frontage, a new 52 slip Private Marina and a premier Leelanau County location within 2 miles of downtown TC! The 4.76 acre parcel includes a prime building site with a private building access through an underground tunnel!

Traverse City, June 2009 Home Sales

I have gathered the sales statistics below for closed sales during June of 2009 and compared them to June of 2008 for the Traverse City 5-county area (Grand Traverse, Leelanau, Antrim, Kalkaska, Benzie).

5-County AreaSold HomesDollar VolumeAverage PriceMedian Price

JUNE 2009195$38,997,270 $199,986$143,000
JUNE 2008178$39,634,192 $222,664$149,751

This report is based upon sales information obtained from the Traverse Area Multiple Listing Service from June 2008 and June 2009. Undisclosed sales are not included in the data.

As you can see home sales have actually increased 9.5% over last year although Median Price has decreased slightly and Average Price has decreased as well. There seems to be quite a bit of activity on the bottom end of the market. In comparison May 2009 had 166 residential units sold, so we are up over 17% from May to June in total unit sales. Also, as many people are curious about the foreclosure market, 57 bank owned properties were purchased in June, which is 29% of the total unit sales.

-Jonathan Oltersdorf